The Hidden Cost of Siloed Channel Data
For many mid-market e-commerce businesses in the DACH region, Amazon and Google operate as parallel universes. Marketing teams often manage these platforms with separate teams, separate budgets, and, most critically, separate data silos. This fragmented view creates a dangerous blind spot: the customer journey rarely stays within one ecosystem. A shopper might discover a product on Amazon, research reviews on Google, and finally purchase on your own website. Conversely, they may see an ad on Google, check availability on Amazon, and buy through a marketplace.
When you optimize channels in a vacuum, you are essentially flying blind. You risk over-investing in channels that appear to drive sales due to last-click bias, while under-funding the channels that actually build the initial demand. Without a unified attribution model, your ROI calculations are speculative. An integrated strategy is not just a technical upgrade; it is the foundational step toward profitable scaling. It allows you to see the true causal relationship between your ad spend and revenue, eliminating the guesswork that plagues 80% of mid-market digital marketing budgets.
Technical Foundations for Clean Data
Before you can apply sophisticated attribution models, you must ensure the underlying data is clean and complete. Amazon and Google use fundamentally different tracking methodologies. If user identities are not correctly assigned and matched across these systems, any subsequent analysis will be flawed.
The first challenge is the erosion of third-party cookies and iOS privacy restrictions. To bypass these limitations, you must implement server-side tracking. This method processes data on your own servers rather than in the user’s browser, ensuring higher data fidelity and compliance with modern privacy standards.
Second, you need persistent user IDs. Implement a robust identity resolution strategy that creates a unique, persistent ID for each customer across the entire journey. This ID must be present in both your CRM and your advertising platforms.
Finally, leverage Data Clean Rooms. These secure environments allow you to link data from Amazon and Google without exposing raw personal data, thereby mitigating GDPR risks. Without this technical infrastructure, any attribution model you build remains a house of cards. Invest in this foundation first; it is the non-negotiable prerequisite for data-driven decisions.
Comparing Platform-Specific Attribution Models
Each platform offers its own attribution insights, but both are incomplete when viewed in isolation. Understanding their specific strengths and weaknesses is crucial for interpreting your data correctly.
| Feature | Amazon Ads | Google Ads |
|---|---|---|
| Primary Model | Last Non-Click | Data-Driven |
| Data Basis | Amazon Ecosystem Only | Google Ecosystem + Partners |
| Lookback Window | 14 Days Standard | Configurable (up to 90 Days) |
| Key Weakness | Ignores offline & non-Amazon interactions | Misses high-intent Amazon shopping behavior |
Amazon’s “Last Non-Click” model is designed to capture the final interaction within the Amazon ecosystem before a purchase. It is excellent for understanding marketplace dynamics but blind to what happened before the user logged in or clicked. Google’s “Data-Driven” model, on the other hand, uses machine learning to assign credit based on historical conversion data across the entire digital journey. However, it often misses the specific, high-intent shopping signals that occur within the Amazon marketplace.
The critical insight here is that Amazon shows you how users are led to purchase on Amazon, while Google shows you the broader digital interaction. Only by combining these two perspectives do you get the full picture of customer behavior. Relying on just one gives you a distorted view of your marketing efficiency.
Implementing a Multi-Touch Strategy
To bridge the gap between these two ecosystems, you must combine their strengths into a centralized view. The core of this strategy is using a Customer Data Platform (CDP) or your existing CRM as the Single Source of Truth. This central repository aggregates data from both platforms, allowing for cross-channel analysis.
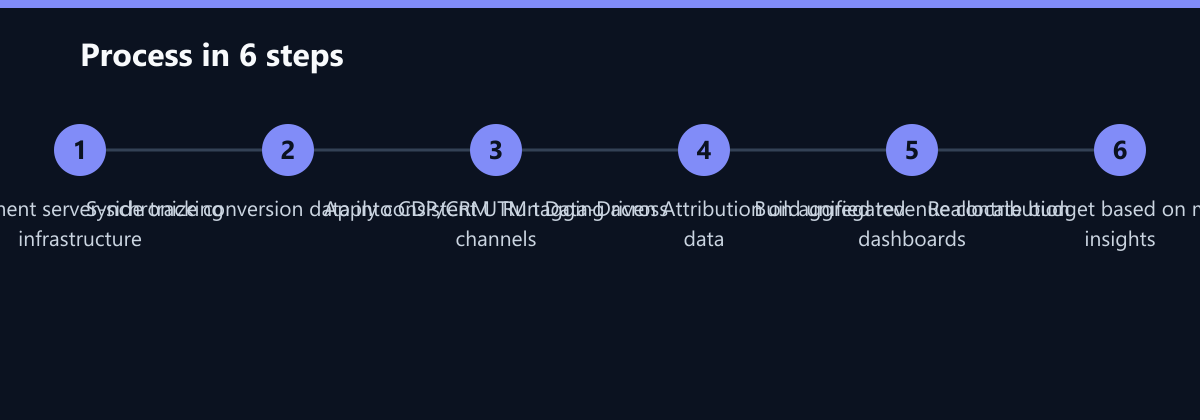
The implementation process follows a logical sequence:
- Data Import: Synchronize conversion data from both Amazon and Google into your CRM. Ensure that the data structure is consistent, using standardized fields for revenue, product ID, and user ID.
- Consistent Tagging: Use UTM parameters rigorously across all channels. Even for Amazon, where native tracking is strong, supplement with your own tagging where possible to maintain traceability in your CRM.
- Modeling: Apply a Data-Driven Attribution model to this aggregated dataset. This model will analyze the sequence of touchpoints and assign credit based on their actual contribution to the conversion, rather than arbitrary rules.
- Reporting: Create unified dashboards that display the contribution of each channel to total revenue. These dashboards should show not just direct sales, but also assisted conversions and brand lift.
This integrated approach allows you to determine whether Google is creating the awareness that Amazon closes, or if Amazon is driving the research that Google converts. It moves you from channel-level vanity metrics to business-level value assessment.
Budget Allocation Based on Insights
The ultimate goal of attribution is not just reporting; it is better budget allocation. If your data reveals that Amazon clicks frequently precede Google searches, then Amazon is functioning as an awareness channel, not just a closing channel. This changes how you should value it.
- Shift Budget: Move funds from channels that show high last-touch impact but low assisted conversion value. These channels are often over-credited by traditional models.
- Test: Run A/B tests on campaigns that specifically target the identified high-value touchpoints. For example, if Amazon retargeting drives significant Google brand searches, increase the budget for Amazon retargeting to see if it boosts overall Google performance.
- Scale: Invest in channels that deliver the highest marginal ROI. This is not always the channel with the highest total revenue, but the one where an additional euro spent generates the most additional profit.
Avoid the “Last-Click Fallacy” at all costs. A click on Amazon may be the final trigger, but the research and consideration took place on Google. Reward both phases of the journey. By aligning your budget with true contribution, you can typically see a 15-20% reduction in wasted spend within the first quarter of implementation.
Typical Mistakes to Avoid
Even with the right tools, teams often make critical errors that undermine their attribution efforts.
- Ignoring the Lookback Window Mismatch: Amazon’s standard 14-day window is often too short for high-consideration products. If you don’t adjust your analysis to account for longer purchase cycles, you will under-credit Amazon for its role in later conversions.
- Over-Reliance on Platform-Native Dashboards: While convenient, Amazon and Google dashboards are designed to show their own value, not the holistic business value. Always export raw data for independent analysis.
- Neglecting Data Hygiene: If your UTM parameters are inconsistent or your user IDs are not properly matched, your multi-touch model will produce garbage. Spend time cleaning your data before modeling it.
- Static Budgeting: Attribution insights are dynamic. If you set your budget once and never revisit it, you will miss shifts in customer behavior and channel efficiency.
How You Measure Success
To determine if your unified attribution strategy is working, track these concrete KPIs:
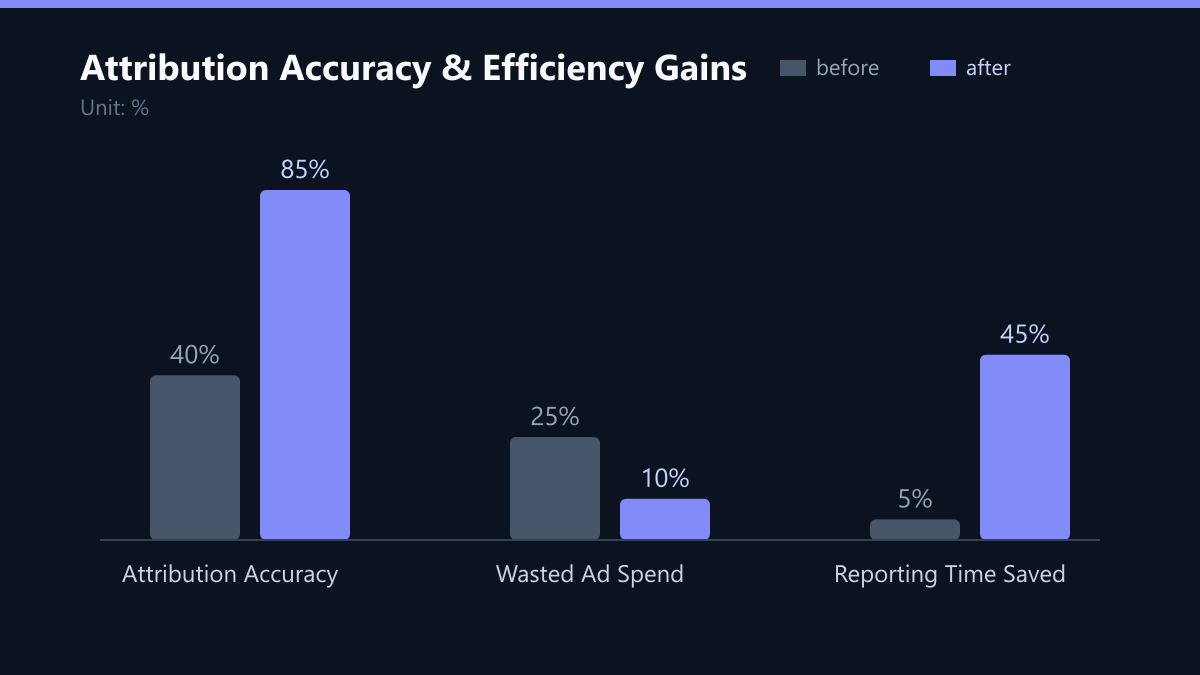
- Attribution Accuracy: Measure the variance between your modeled revenue and actual reported revenue. A reduction in variance indicates better data quality. Aim for a variance of less than 5%.
- Wasted Ad Spend: Calculate the percentage of budget allocated to channels with negative or zero marginal ROI. A successful implementation should reduce this figure significantly, often by 10-15 percentage points.
- Reporting Time: Track the time your team spends manually consolidating data from different platforms. A centralized CDP should reduce this time by at least 40%, freeing up resources for strategy and optimization.
By monitoring these metrics, you can quantify the impact of your attribution strategy and demonstrate its value to stakeholders. This data-driven approach ensures that your marketing budget is always working as hard as possible to drive profitable growth.
Passend dazu
- Tracking & Attribution
- B2B Industry: 34% CPA Reduction through Dynamic Google Ads Campaigns and HubSpot Attribution in the DACH Region
- Marketplace & Amazon Ads
- SEA (Google & Bing Ads)
- Facebook Group Management for a Spanish Fashion E-Commerce Brand
- Compliance-Compliant Partner Attribution for Fintech Affiliates in Southern Europe
- Centralized KPI Dashboards for Multi-Marketplace E-Commerce
- Exit-Intent Popups: Legally Secure Implementation and Best Practices for DACH
- AI Visibility in the DACH Region: How a Mid-Sized Machine Manufacturer Doubled Its Rankings in ChatGPT and Perplexity
- Industriezulieferer DACH: Geotargeting in Google Local Services Ads steigert die Anruf-Conversion um 60% in 6 Monaten