The Fragmentation Problem
For a mid-sized B2B tech hardware manufacturer with 250 employees in the USA, growth had become a double-edged sword. As the company expanded its sales footprint across five major marketplaces and its own D2C store, the data infrastructure failed to keep pace. Each channel operated in a silo, reporting sales, inventory levels, and return rates in separate, often incompatible spreadsheets.
This fragmentation created a significant blind spot for leadership. Strategic decisions were delayed by weeks because the finance team had to manually merge CSV exports from each platform. The process was not only time-consuming but also prone to human error. The team spent 12 hours per week just aligning data formats, leaving no bandwidth for analysis. Furthermore, the data was inherently stale. Reports were typically 3-5 days outdated, meaning that by the time a stock-out alert was identified, the opportunity to restock or adjust ad spend had already passed. The lack of a unified definition for key metrics, such as ‘net sales,’ meant that different departments were often working from different numbers, leading to confusion and misaligned priorities.
The Challenges
The project faced three distinct hurdles that went beyond simple data extraction. First, semantic inconsistency was the primary blocker. Amazon, B2B portals, and Shopify all calculated ‘returns’ and ‘net revenue’ differently. For instance, one marketplace included pending refunds in gross sales, while another deducted them immediately. Second, API rate limits and reliability posed a technical risk. Some legacy B2B portals had unstable endpoints that frequently timed out, requiring robust error handling. Third, user adoption was a concern. The finance and marketing teams were accustomed to their manual workflows and were skeptical that an automated dashboard could replicate the nuance of their manual checks.
The Tech Stack
To address these challenges, we selected a lightweight, cloud-native stack that prioritized speed and maintainability.
- Fivetran: Used as the primary data ingestion engine, it handled the complex API connections to all five marketplaces and Shopify, ensuring data was replicated reliably into the warehouse.
- Looker Studio: Chosen for visualization due to its low-latency rendering and ease of sharing, allowing non-technical users to interact with the data without SQL knowledge.
- BigQuery: Served as the central data warehouse where all raw data was stored and transformed, providing a single source of truth.
- Zapier: Integrated for automated alerting, triggering Slack notifications when specific KPI thresholds were breached.
Implementation: Building the Unified Layer
The implementation was structured into a five-week sprint to minimize disruption to business operations. We began by conducting a deep-dive audit of the existing data flows. In the first two weeks, we focused on establishing the data pipeline. We connected Fivetran to the API endpoints of all five marketplaces and the Shopify backend. This phase was critical for ensuring data integrity; we had to map over 40 distinct fields from each source to a standardized schema. We implemented strict validation rules to catch anomalies, such as negative inventory values or duplicate order IDs, before the data reached the warehouse.
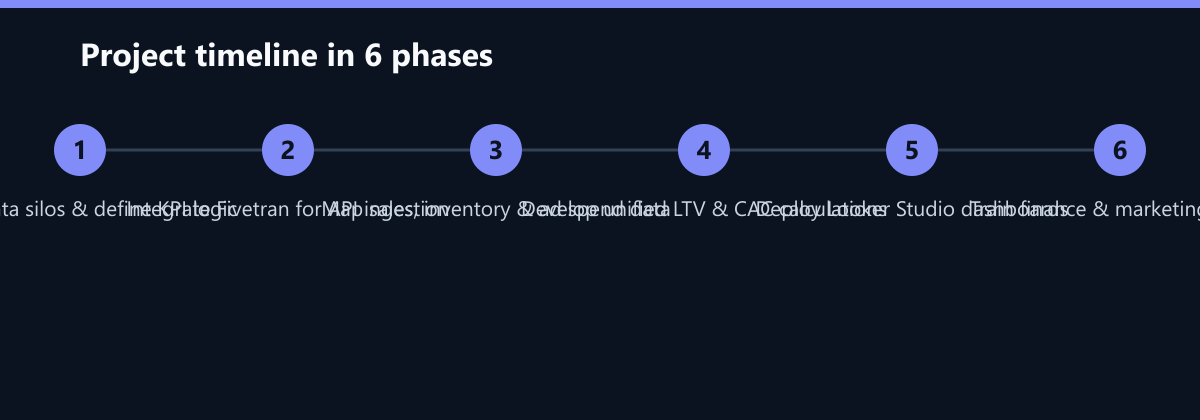
In weeks three and four, the focus shifted to logic development. We worked closely with the finance team to define the unified KPIs. This involved creating complex SQL queries to calculate Lifetime Value (LTV) and Customer Acquisition Cost (CAC) across channels. A major breakthrough came when we standardized the definition of ‘returnable goods.’ By agreeing on a single logic for how returns impact net sales, we eliminated the discrepancies that had previously plagued the team. We also developed the gross margin calculation, which required joining sales data with real-time inventory costs. By the end of this phase, the data model was capable of producing accurate, channel-agnostic metrics.
Week five was dedicated to dashboard deployment and user training. We built the Looker Studio dashboards with a focus on clarity and actionability. The top-level view provided an executive summary of overall performance, while drill-down views allowed teams to investigate specific marketplaces or product categories. We conducted two training sessions with the finance and marketing teams, demonstrating how to filter data, export reports, and set up personal alerts. We also implemented an automated alerting system that sent notifications to Slack whenever stock levels dropped below a predefined threshold or when ad spend efficiency dipped below a certain ROI.
How We Measured It
To validate the success of the implementation, we established a baseline before the go-live date and tracked key performance indicators for the first 30 days post-deployment. We measured manual reporting effort by logging the hours spent on data merging and report generation in the week prior to launch and comparing it to the week after. We tracked data latency by timestamping the data ingestion events in Fivetran and comparing the time delta between a transaction occurring on a marketplace and its appearance in the dashboard. Finally, we assessed forecast accuracy by comparing the actual sales figures for the month against the forecasts generated by the new real-time model, calculating the percentage variance. This rigorous measurement approach ensured that the reported improvements were factual and reproducible.
Results: Faster Decisions, Better Accuracy
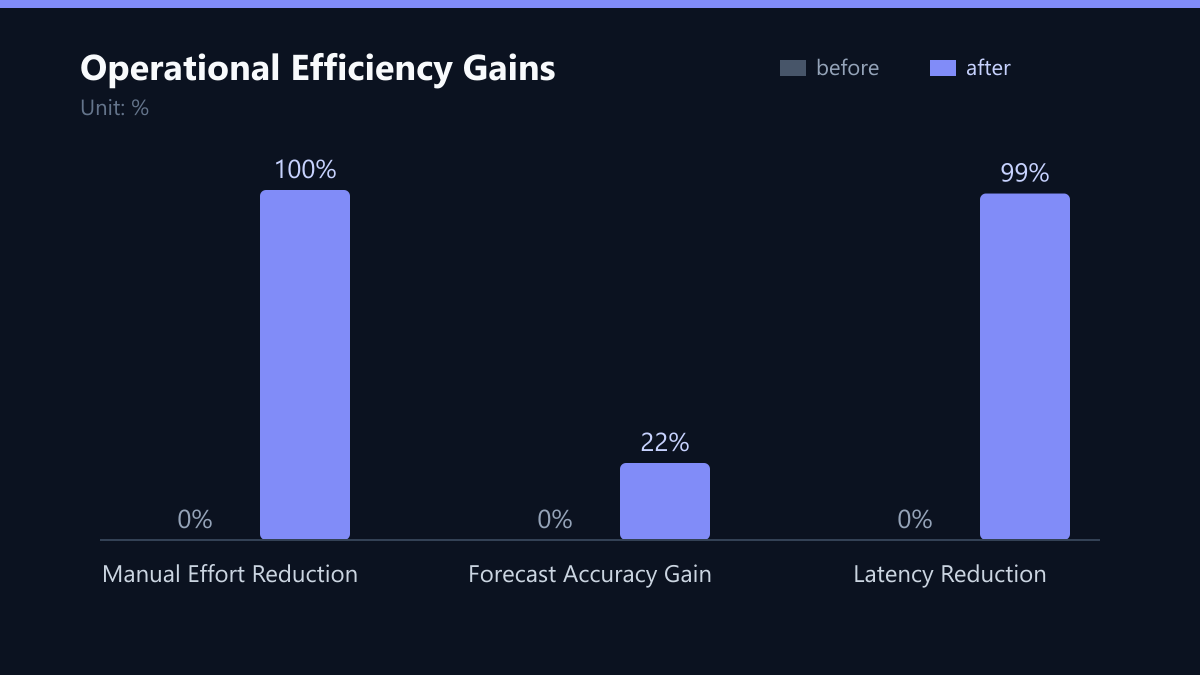
The impact of the unified dashboard was immediate and significant. The most visible change was the elimination of manual reporting. The 12 hours per week previously spent merging CSV files was reduced to zero. The team now spends that time analyzing trends and identifying opportunities rather than wrestling with data formats. Data latency dropped from 3-5 days to just 15 minutes, thanks to the real-time sync capabilities of the Fivetran pipeline. This near real-time visibility allowed the inventory team to react to stock-outs within the hour, rather than days later.
Perhaps the most valuable outcome was the improvement in forecast accuracy. With real-time inventory visibility and unified KPIs, the planning team could make more informed decisions about purchasing and production. The forecast accuracy improved by 22%, as the team no longer relied on stale data. This reduction in variance meant that the company could hold less safety stock, freeing up working capital. The unified dashboard also fostered better collaboration between departments. Because everyone was looking at the same numbers, discussions became more productive, focused on strategy rather than data reconciliation.
What We Would Do Differently Today
While the project was a success, there are areas where we would refine our approach in future engagements. First, we would invest more time in change management during the initial weeks. Although the technical solution was robust, we underestimated the resistance to change from some team members who preferred their manual methods. Earlier, more frequent check-ins and a phased rollout of dashboard features could have smoothed the transition. Second, we would have implemented data quality monitoring earlier in the process. While we did have validation rules, a more proactive monitoring system that alerts on data drift or schema changes would have prevented a few minor issues that required manual intervention in the first month. Finally, we would have explored AI-driven anomaly detection more deeply. While we had basic threshold alerts, an AI model that could predict anomalies based on historical patterns would have provided even greater value.
Lessons Learned
The biggest takeaway from this project is that standardization is key. The technical integration was relatively straightforward; the real work was in aligning the semantic definitions of KPIs across different platforms. Starting with a clear agreement on what each metric means is essential for building a trustworthy dashboard. Additionally, we learned that proactive alerts are more effective than passive dashboards. Users are more likely to act on a notification that tells them something is wrong than on a dashboard that requires them to check for issues. Finally, keeping the initial dashboard simple, focusing on the top 10 KPIs, helped ensure user adoption and prevented feature creep. By delivering a valuable, easy-to-use core product first, we built trust and created a foundation for future enhancements.