The Situation: Rising Costs and Data Blind Spots
The client, a specialized B2B logistics provider based in Lyon with 150 employees, was facing a critical challenge: their Customer Acquisition Cost (CAC) was rising steadily, despite a growing affiliate partner network. While the partners were delivering a high volume of leads, the quality of these leads varied significantly. Without granular reporting capabilities, the marketing and sales teams operated in the dark, unable to measure the true Return on Investment (ROI) of individual partners or identify which channels were effectively inactive or draining budget.
The core of the problem lay in the manual analysis of Excel spreadsheets. Marketing and sales worked with outdated data, often weeks old, which led to incorrect budget allocations and missed opportunities for agile optimization. There was a lack of a central dashboard that displayed performance in real time. Crucially, partners were ranked by lead quantity rather than lead quality, incentivizing volume over value. This misalignment meant that the company was paying for leads that rarely converted into sales opportunities, driving up the CAC per qualified lead (SQL).
The Challenges
Several concrete hurdles had to be overcome to transform the affiliate program from a volume-driven cost center into a profit-driven growth engine:
- Fragmented Data Sources: Lead data was scattered across multiple affiliate platforms and the CRM, with no unified view. Manual consolidation was time-consuming and error-prone.
- Cookie Limitations: B2B buyers often use corporate devices with strict privacy settings, leading to lost attribution data when relying solely on client-side cookies.
- Misaligned Incentives: Partners were compensated based on lead volume, not quality. This encouraged spammy or low-intent leads to boost partner metrics.
- Lack of Real-Time Visibility: The weekly manual reporting cycle was too slow to react to market changes or partner performance dips.
The Tech Stack
To address these challenges, we implemented a robust, automated tracking and reporting stack:
- Server-Side Tracking Tool: To bypass cookie restrictions and ensure accurate attribution in a B2B environment.
- HubSpot CRM: The central system of record for all lead data, enhanced with dynamic fields for partner identification.
- Webhook Integration: For real-time event transmission (Lead Creation, MQL, SQL) between the tracking tool and the CRM.
- Power BI: The central dashboard for the marketing team, visualizing real-time partner performance.
- Automated Email System: For sending weekly performance reports to partners, ensuring transparency and accountability.
Implementation: From Manual Chaos to Automated Clarity
The implementation phase focused on technical integration and the redefinition of partner selection criteria. We moved away from a “more is better” mindset to a “quality first” approach.
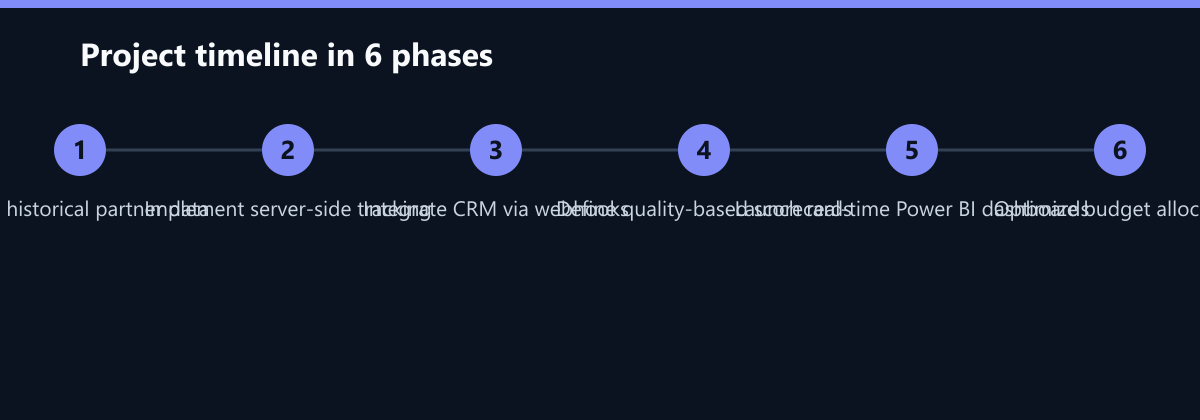
Technical Integration & Tracking: We started by setting up a dedicated affiliate tracking tool with server-side tracking. This was crucial for bypassing cookie limits common in B2B environments. We then established an automatic lead import into the client’s HubSpot CRM. This import included dynamic fields for partner ID and campaign source, ensuring that every lead was traceable back to its origin. To enable real-time insights, we set up webhooks for the transmission of key events, such as Lead Creation, Marketing Qualified Lead (MQL), and Sales Qualified Lead (SQL) status changes.
Data-Driven Partner Selection: With the technical foundation in place, we conducted a historical data analysis of the last 12 months. The goal was to identify the top 10 partners by lead quality, not just volume. We defined a new scorecard criteria set: conversion rate, CAC per qualified lead, and lead churn rate. Based on this analysis, we excluded partners whose CAC exceeded the defined break-even point. This was a difficult but necessary step, as it required terminating or renegotiating partnerships that were no longer profitable.
Reporting & Governance: To sustain the new approach, we created a central Power BI dashboard for the marketing team. This dashboard provided real-time visibility into partner performance, allowing for agile budget adjustments. We also set up weekly automated email reports to partners, including individual performance metrics. This transparency helped align partner incentives with the client’s goals. Finally, we implemented alert rules for anomalies in traffic or lead behavior, enabling the team to quickly detect and address potential fraud or technical issues.
How We Measured It
To ensure the KPIs were accurate and actionable, we defined a rigorous measurement methodology:
- CAC Calculation: We calculated CAC per SQL by dividing the total affiliate spend (commissions + platform fees) by the number of Sales Qualified Leads generated in the period. This provided a direct measure of acquisition efficiency.
- Lead Quality Scoring: We scored leads based on their conversion to Opportunity within the CRM. A lead was considered “high quality” if it converted to an Opportunity within 30 days. This metric was used to rank partners and inform budget allocation.
- Effort Tracking: We tracked the time spent by the marketing team on manual reporting before and after the implementation. This was done through time-tracking software and self-reported hours, providing a clear measure of the efficiency gains from automation.
Results: Significant Efficiency Gains
After three months of the optimized campaign, a significant increase in efficiency was observed in the acquisition funnel. The focus on high-quality partners led to a substantial cost reduction and improved sales conversion.
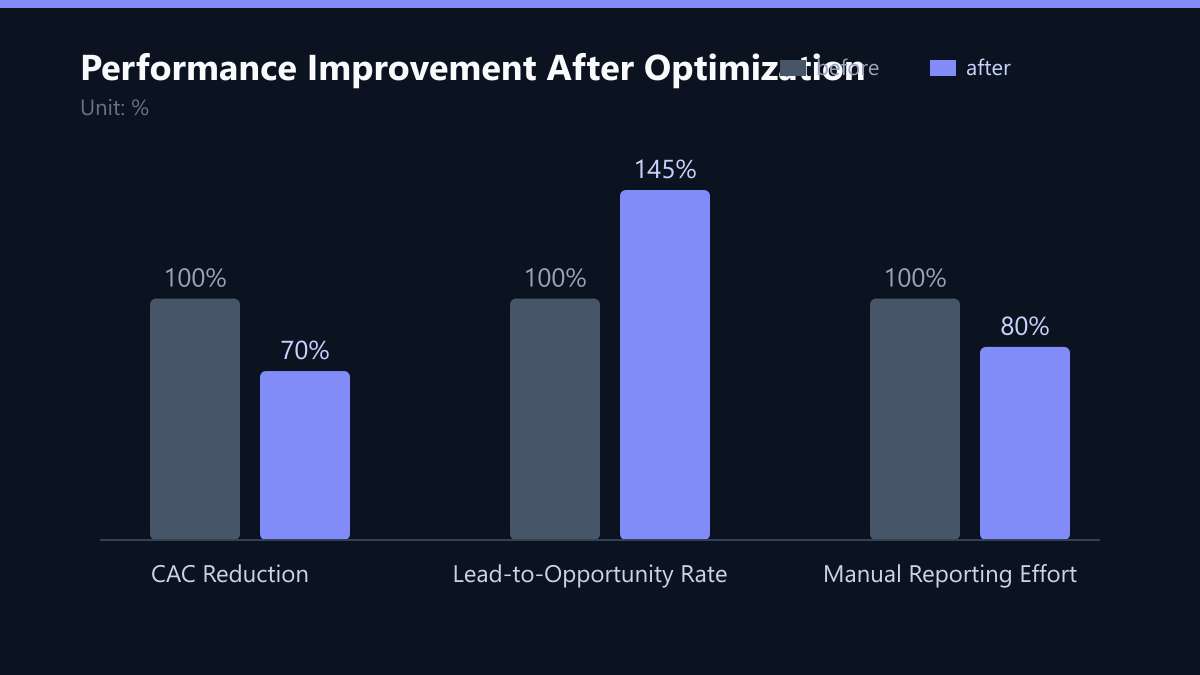
Key KPIs after 3 months:
- 30% Reduction in Acquisition Costs: The CAC per qualified lead (SQL) dropped by 30%, directly impacting the bottom line.
- 45% Increase in Lead-to-Opportunity Rate: Due to better partner quality, the conversion rate from Lead to Opportunity increased by 45%, indicating that sales was receiving more relevant leads.
- 20% Less Manual Work: The marketing team reported a 20% reduction in time spent on manual reporting tasks, thanks to automated dashboards and reports.
Partnerships with top performers were intensified, with higher commission structures or preferred access to new campaigns. Collaboration with underperforming partners was renegotiated or terminated. The marketing team was able to shift the budget strategically to the most profitable channels, creating a virtuous cycle of performance and growth.
Lessons Learned
The success of the campaign was based not on the number of partners, but on the quality of the data. Pure volume optimization would have further increased costs and strained the sales team. The key takeaways from this project are:
- Quality over Quantity: Fewer, but more precise partners yield higher margins. It is better to have 10 high-quality partners than 50 low-quality ones.
- Real-Time Data is Crucial: Manual analyses prevent agile adjustments to the campaign. Real-time visibility allows for quick reactions to market changes and partner performance dips.
- Technical Hygiene is Non-Negotiable: Server-side tracking is essential in B2B environments with complex cookie policies. Without accurate attribution, it is impossible to measure ROI or optimize spend.
Close collaboration between marketing and sales was the key to success. By jointly defining lead quality criteria, both departments were able to work in unison, ensuring that the affiliate program aligned with the overall sales strategy.
What We Would Do Differently Today
While the project was a success, there are areas where we could improve:
- Earlier Partner Communication: We could have involved partners earlier in the process, explaining the shift from volume to quality metrics. This might have reduced resistance and friction during the renegotiation phase.
- More Granular Alerting: The initial alert rules were broad. We could have implemented more granular alerts for specific partner behaviors, allowing for even faster intervention in case of anomalies.
- Automated Budget Reallocation: While we manually shifted the budget, we could have implemented automated rules for budget reallocation based on real-time performance, further enhancing agility.
Passend dazu
- Marketing Strategy & Consulting
- Affiliate Compliance in Germany: Data Privacy Compliant Cookie Solutions for Partner Programs
- Performance Marketing
- Amazon Ads vs. Google Ads: Attribution Strategy for Mid-Market E-Commerce
- GEO Strategy for HubSpot Blogs: Visibility in AI Answer Engines for DACH Markets
- Affiliate Marketing
- Content & CRO
- CRM Marketing
- Compliant Partner Attribution for Fintech Affiliates in Southern Europe
- 32 % geringere Akquisekosten durch GEO-optimierte Produktseiten
- Increasing Conversion Rate by 25% through Landing Page Optimization and Bing Ads Targeting for a US B2B Cloud Service Provider
- Reduktion der Amazon Advertising ACOS um 18 % durch dynamische Bid-Regeln
- LinkedIn Campaign Optimization: Reducing CPL by 28% for a FinTech Provider in Scandinavia through Server-Side Tracking and A/B Testing
- CPS vs CPA: Structuring Affiliate Payouts for Optimal Margins
- Affiliate Networks for B2B SaaS: EPC and Cookie Duration Comparison
- Automated Affiliate Payouts: Integrating Platforms with CRM Systems
- Cookieless Affiliate Marketing: Practical Alternatives for B2B Agencies
- Why ROAS Alone Fails in B2B Affiliate Partner Evaluation
- Legal Compliance for Affiliate Partnerships Under GDPR and TDDDG
- Avoid Affiliate Reporting Errors: 5 KPIs to Track Immediately
- 5 KPIs to Identify Bot Traffic in Affiliate Programs
- Snapchat Ads: Young Targeting Campaign for FMCG in Scandinavia
- AI Search Engine Ranking for Spanish Logistics Software: Increasing Organic Clicks by 40%
- A9-Algorithmus verstehen: Produkt-Rankings durch optimierte Backend-Suchbegriffe steigern
- Detecting Affiliate Fraud in Your CRM: 5 Warning Signals
- Structuring Affiliate Commissions: Fixed vs. Percentage in B2B
- Reducing CPC by 25 Percent through Negative Keyword Strategies in the Spanish Financial Sector
- TikTok Awareness for FMCG in Southern Europe: 15% Lower CPM through UGC Strategy
- E-Mail Frequency Capping: Vermeidung von Unsubscribes durch smarte Limits
- Krisenkommunikation im B2B: Reputationsrettung eines Logistik-Startups in den Niederlanden durch automatisierte Sentiment-Alerts