The Shifting Landscape of B2B Discovery in DACH
For years, the B2B digital funnel was dominated by a single narrative: Google is for research, and sales teams handle the rest. However, the behavior of operational buyers in the DACH region has fundamentally shifted. Modern procurement managers no longer wait for a vendor call to compare prices and availability. They increasingly turn to marketplaces like Amazon Business to validate product specifications, check stock levels, and compare operational costs before ever submitting a formal Request for Proposal (RFP).
This shift creates a critical divergence in how we approach paid acquisition. Google Shopping remains the undisputed king of generic search, reaching a broad audience at various stages of the consideration journey. Yet, this breadth comes at a cost: a mixed intent level that ranges from casual research to serious purchase intent. In contrast, Amazon Business attracts users who are operationally oriented. They are not browsing for inspiration; they are looking for available items with immediate delivery. Understanding this behavioral split is the first step toward optimizing your return on investment (ROI) in the mid-market sector.
Deconstructing the Cost-Per-Click Reality
When evaluating channel performance, the Cost-Per-Click (CPC) is often the first metric examined, but it is rarely the whole story. In the B2B environment, the structural differences between platforms lead to significant disparities in click costs. Amazon Ads frequently achieves lower CPCs because the competition for long-tail, specific product keywords is less saturated than on Google. On the other hand, Google Shopping is subject to aggressive bidding strategies from a wider pool of advertisers, driving up the average cost.
To illustrate this, consider the typical metrics observed in the DACH B2B sector:
| Metric | Amazon Ads | Google Shopping |
|---|---|---|
| Avg. CPC (B2B) | €0.45 – €1.20 | €1.50 – €3.50 |
| Competition Level | Medium | High |
| Keyword Volume | Niche/Long-tail | Extremely High |
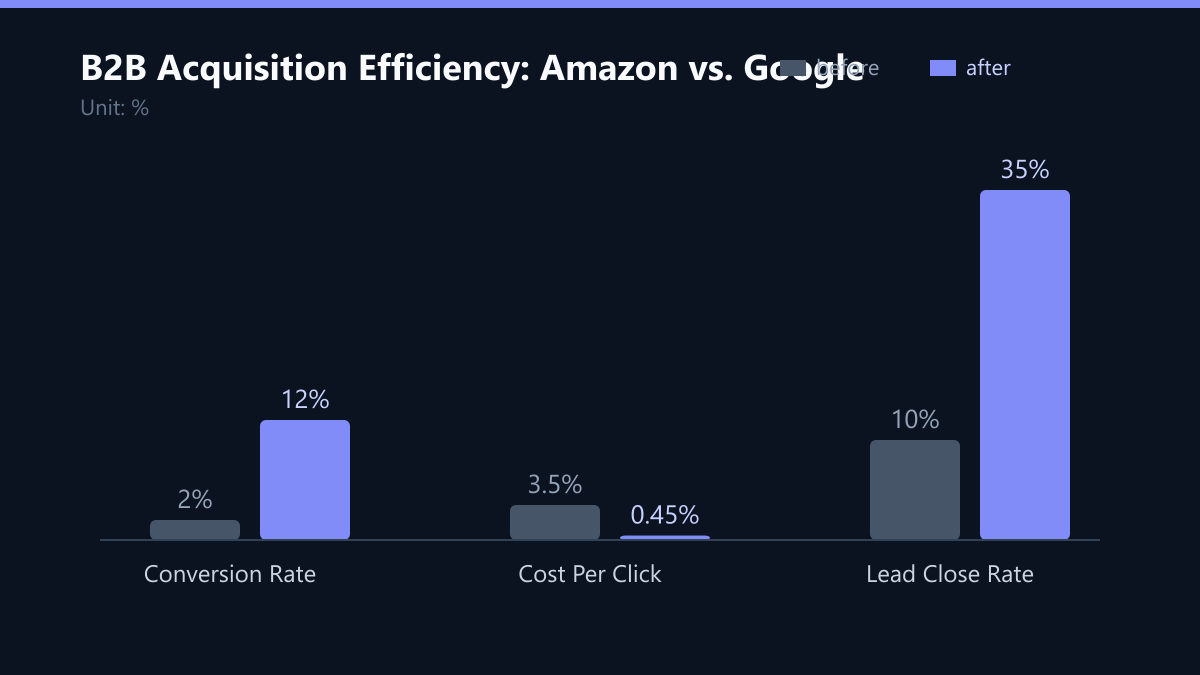
It is crucial to note that a lower CPC on Amazon does not automatically translate to higher profitability. The quality of the click varies significantly. A €0.50 click from a user who is just checking inventory prices may have a lower value than a €3.00 click from a user ready to purchase a bulk order. Therefore, CPC must always be analyzed in conjunction with conversion quality and downstream sales data.
Conversion Rates and the Quality of Leads
The true determinant of ROI is not how many leads you generate, but how many of them close. This is where the distinction between the two platforms becomes stark. Amazon Business users are typically operationally focused. They seek immediate availability and clear pricing. Consequently, the conversion rates for direct purchases or qualified RFPs are significantly higher.
In contrast, Google Shopping generates higher volume but often includes more unqualified inquiries. Users may submit forms to request catalogs or compare options, but they are not necessarily ready to buy. This requires a different sales approach and often results in a longer sales cycle.
- Amazon Conversion Rate: Typically 8–12% for direct purchases or high-quality RFPs.
- Google Conversion Rate: Typically 2–5% for form submissions and catalog inquiries.
- Lead Quality: Amazon leads consistently show a higher close rate in the subsequent sales process.
For product catalogs with clearly defined SKUs, Amazon is often the more efficient channel for direct closing. However, for complex solutions that require education and consultation, Google’s broader reach may still be necessary to build the top of the funnel.
Technical Integration and the Tracking Gap
Measuring ROI is not just about what happens on the platform; it is about what happens afterward. Technical implementation plays a pivotal role here. Both platforms require clean data integration, but their tracking capabilities differ significantly due to architectural limitations.
Google offers deep, full-funnel tracking capabilities through GA4 and Consent Mode. You can track user journeys across devices, retarget based on site behavior, and attribute conversions with high precision. Amazon, however, operates within a more isolated ecosystem. Cross-device tracking is limited, and the focus is primarily on on-platform KPIs.
This limitation means that without additional measures, you will significantly underestimate the value of Amazon Ads. Many B2B purchases on Amazon result in offline negotiations or repeat orders that are not captured by standard on-site tracking. Therefore, the recommendation is to implement offline conversion tracking. By feeding closed deal data back into Amazon Ads, you can measure the true B2B ROI and allow the algorithm to optimize for high-value customers rather than just cheap clicks.
Strategic Roadmap for Mid-Market Success
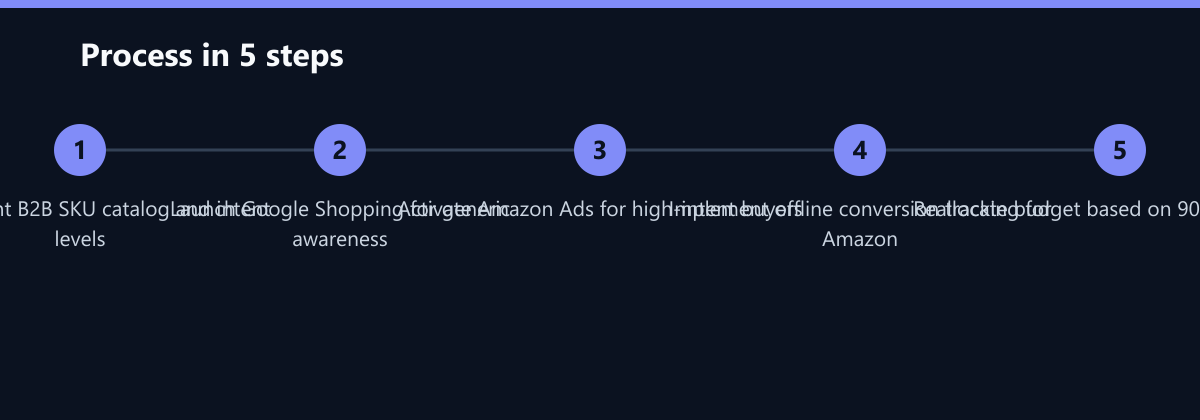
A single-channel approach is rarely optimal in modern B2B marketing. The most effective strategy combines the strengths of both platforms to cover the entire customer journey. Instead of choosing one, you should orchestrate a phased rollout that allocates resources based on performance.
-
Phase 1: Awareness and Generic Search (Google Shopping) Start with Google Shopping to capture users in the research phase. This builds brand visibility and captures high-volume, generic keywords. The goal here is not immediate conversion, but rather to establish presence and drive traffic to your content or landing pages.
-
Phase 2: High-Intent Capture (Amazon Ads) Simultaneously, activate Amazon Ads to target operational buyers who are ready to purchase. Focus on your best-selling SKUs and long-tail products where Amazon’s lower CPCs and higher conversion rates shine. This phase captures the bottom of the funnel efficiently.
-
Phase 3: Data-Driven Reallocation After 6–8 weeks, analyze the data. Use offline conversion tracking to assess the true lifetime value (LTV) of leads from both channels. Reallocate your budget based on these insights. A common starting point is to invest 60% of the budget in the channel with the higher conversion rate (often Amazon for direct SKUs) and 40% in the channel with broader reach (Google) for long-term pipeline generation.
Typical Mistakes to Avoid
Even with a solid strategy, teams often fall into specific traps that erode ROI.
- Ignoring Offline Conversions on Amazon: Relying solely on on-site metrics leads to underestimating Amazon’s value. If you do not track offline deals, your algorithms will optimize for cheap clicks rather than high-value customers.
- Treating All Leads Equally: Applying the same follow-up process to Amazon and Google leads is inefficient. Amazon leads are often ready for immediate action, while Google leads may require nurturing. Tailoring your sales approach to the source of the lead improves close rates.
- Neglecting Product Feed Optimization: Both platforms rely heavily on product data. If your titles, descriptions, and images are not optimized for B2B buyers (who look for specifications and bulk pricing), you will pay for clicks that do not convert. Ensure your feeds highlight operational benefits, not just features.
How You Measure Success
To ensure your strategy is working, you need to track specific KPIs that reflect both efficiency and effectiveness.
- Cost Per Acquisition (CPA): Calculate the total ad spend divided by the number of closed deals. Compare this across channels. For B2B, a CPA of €150–€300 might be acceptable depending on the product margin, but the trend is what matters.
- Return on Ad Spend (ROAS): Track revenue generated per euro spent. For Amazon, aim for a ROAS of 4x or higher for direct purchases. For Google, a ROAS of 2x–3x may be acceptable if the LTV is high.
- Lead Quality Score: Implement a scoring system in your CRM. Assign higher scores to leads that come from Amazon Business due to their higher intent. Monitor the correlation between lead source and close rate over time.
- Click-Through Rate (CTR): Monitor CTR to gauge relevance. A low CTR on Amazon may indicate that your product listing is not compelling enough for the specific keywords targeted. A low CTR on Google may indicate that your ads are too broad or your pricing is uncompetitive.
By consistently monitoring these metrics and adjusting your strategy based on data, you can maximize your ROI and ensure that your B2B marketing efforts are not just generating traffic, but generating revenue.
Passend dazu
- Reduktion der Amazon Advertising ACOS um 18 % durch dynamische Bid-Regeln
- Automated Campaign Management: 40% ROAS Increase for a DACH Industrial Supplier through Dynamic Budget Allocation in Amazon DSP
- Marketplace & Amazon Ads
- SEA (Google & Bing Ads)
- TikTok Ads vs. Instagram Reels: CAC Comparison for D2C Fashion in Scandinavia
- Exit-Intent Popups: Legally Compliant Implementation and Best Practices for DACH
- Industriezulieferer DACH: Geotargeting in Google Local Services Ads steigert die Anruf-Conversion um 60% in 6 Monaten