The Starting Point: Rising Costs and Stagnant Growth
A Swedish D2C fashion label with 25 employees found itself in a familiar trap: rising acquisition costs without a corresponding increase in conversion quality. Over a six-month period, their Customer Acquisition Cost (CAC) on Meta platforms had surged by 40%, while conversion rates remained flat. The team suspected ad fatigue and a narrowing of their addressable audience reach. They needed a structured, data-driven comparison to determine how to allocate their limited paid social budget efficiently between two dominant short-form video platforms: TikTok and Instagram Reels.
The core issue was not just cost, but efficiency. The brand was spending more to acquire fewer high-value customers. They required a diagnostic phase to understand which channel was driving volume, which was driving value, and where the creative strategy was failing.
The Challenges
Before implementing a new strategy, we identified three specific hurdles that had been undermining the client’s performance:
- Attribution Blind Spots: The client was relying on browser-based pixels, which were increasingly unreliable due to iOS privacy changes. This led to inaccurate CAC calculations and missed conversion data.
- Creative Fatigue: The same polished, high-production ads were being pushed across both platforms. This resulted in declining CTRs and higher frequency caps, causing users to ignore the brand.
- Homogeneous Targeting: Both channels were using identical broad interest-based audiences. This failed to leverage the distinct behavioral differences between TikTok’s discovery-driven algorithm and Meta’s interest-graph-based targeting.
The Tech Stack
To execute this optimization, we utilized a lean but powerful stack focused on accuracy and creative agility:
- TikTok Ads Manager: For campaign management, creative testing, and audience segmentation on the TikTok platform.
- Meta Ads Manager: For managing Instagram Reels campaigns and retargeting funnels on the Meta ecosystem.
- Server-Side Tracking (SST): A custom implementation to send conversion data directly from the client’s backend to ad platforms, bypassing browser restrictions.
- CapCut: For rapid, native-style video editing to match platform aesthetics and reduce production time.
- Google Analytics 4 (GA4): For cross-channel attribution analysis and LTV tracking to validate the quality of acquired customers.
Implementation: The 8-Week Parallel Test
We designed an eight-week parallel testing phase. The objective was to isolate channel performance without cross-contamination of audiences. This required a strict separation of roles: TikTok was tasked with prospecting and volume acquisition, while Instagram Reels was assigned to brand affinity and retargeting.
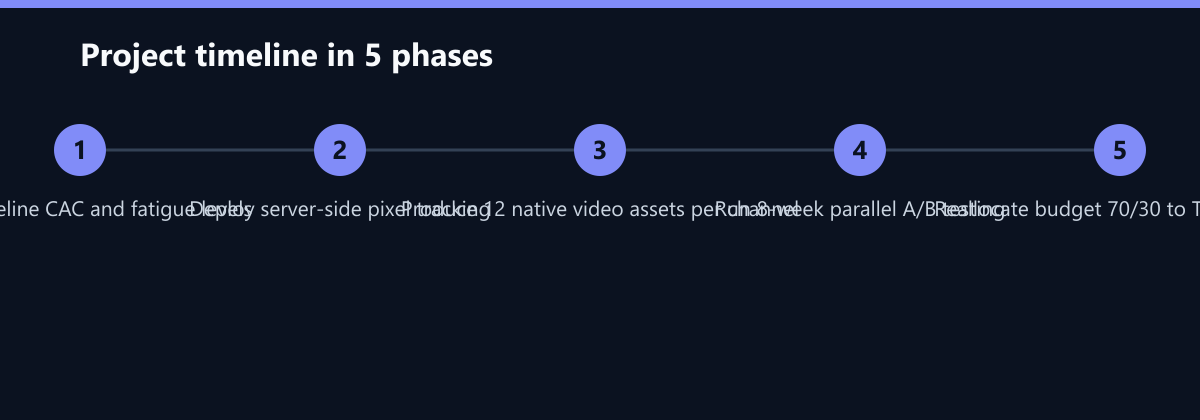
The first two weeks were dedicated to infrastructure. We implemented server-side tracking to ensure that every conversion was accurately attributed. This was critical because the previous 40% CAC increase was partially an artifact of tracking loss. We also audited the client’s historical data to identify high-LTV customers from the past 12 months, which served as the seed for our lookalike audiences.
Creative production was the next major focus. We produced 12 native-style video assets per platform. These were not polished commercials but user-generated content (UGC) style videos, shot on mobile, with minimal editing. The goal was to mimic the organic feed experience of each platform. For TikTok, we focused on trending sounds and quick hooks. For Reels, we emphasized aesthetic consistency and brand storytelling.
The budget was split 50/50 initially to establish a baseline. We monitored daily CTR, CPC, and CPA metrics closely. By week four, it was clear that TikTok was outperforming Meta on raw acquisition metrics, but Meta was retaining users better in the short term.
The Channel Comparison: Data-Driven Insights
The data revealed distinct behavioral differences between the two platforms. TikTok drove higher volume at a lower cost, while Instagram showed stronger brand affinity and higher order values. The table below summarizes the baseline performance during the first four weeks of the test:
| Metric | TikTok Ads | Instagram Reels |
|---|---|---|
| Average CAC | €14.20 | €18.50 |
| CTR | 3.8% | 2.1% |
| ROAS | 2.8x | 2.1x |
| Avg. Order Value | €65 | €78 |
This data highlighted a crucial insight: TikTok was the volume engine, while Instagram was the value engine. The lower AOV on TikTok was offset by the significantly lower CAC. However, the higher AOV on Instagram meant that while fewer customers were acquired, each one was worth more in the long run.
Results and KPIs
Based on the mid-test data, we shifted the strategy. We reallocated 70% of the budget to TikTok for prospecting and 30% to Meta for retargeting and brand reinforcement. This blended approach allowed us to capture the low-cost volume from TikTok while leveraging Meta’s superior retargeting capabilities to convert warm leads.
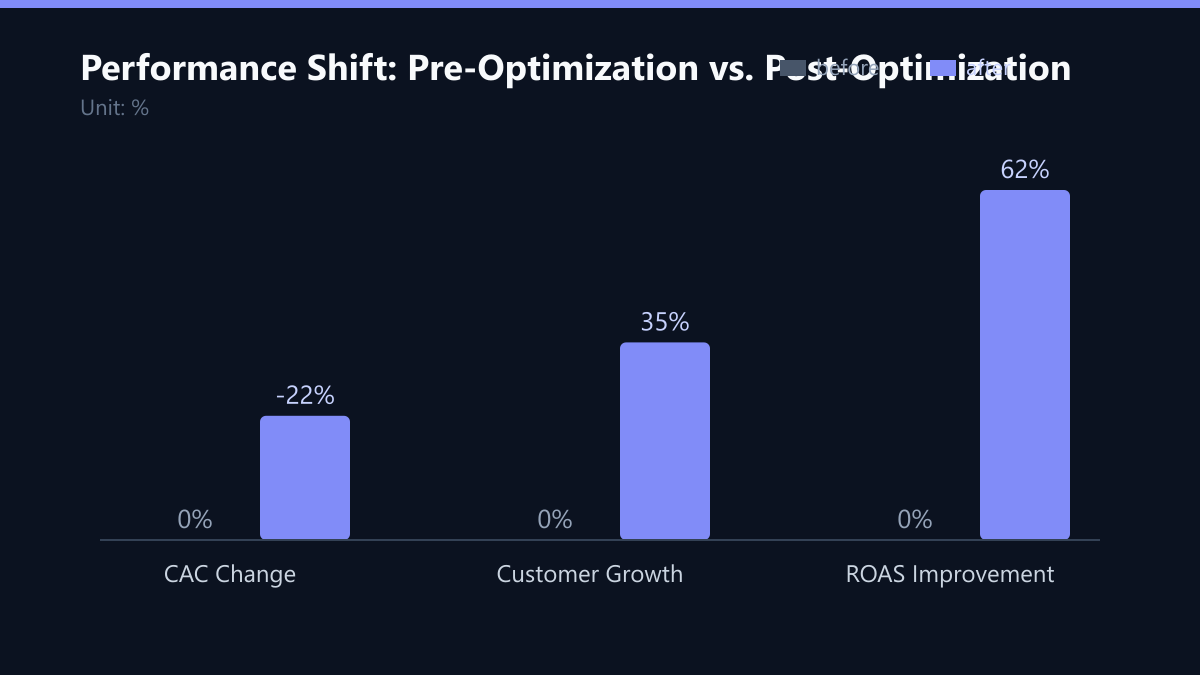
By the end of the eight-week period, we achieved significant efficiency gains. Overall CAC decreased by 22% compared to the pre-test baseline. This was not just a result of cheaper clicks, but a structural improvement in how the budget was deployed. The blended ROAS increased to 3.4x, up from the pre-test average of 2.4x. Additionally, new customer volume grew by 35% month-over-month, driven by the higher frequency tolerance on TikTok, which delayed creative fatigue by four weeks.
How We Measured It
To ensure the integrity of these results, we used a multi-layered measurement approach. First, we established a strict baseline period of four weeks before the test to account for seasonal fluctuations in the fashion industry. Second, we used server-side tracking to eliminate the 15-20% data loss typically seen with browser-only pixels. This allowed us to attribute conversions accurately even when users had cookies disabled. Third, we tracked Lifetime Value (LTV) for 90 days post-acquisition to ensure that the lower CAC on TikTok did not come at the cost of lower retention. The data showed that TikTok-acquired customers had a 92% retention rate at 90 days, comparable to Meta-acquired customers, validating the quality of the volume.
Lessons Learned
The primary lesson was that TikTok is not just for Gen Z. It works for broader D2C fashion audiences in Scandinavia, provided the content feels native. The key is low-production-value, authentic content that respects the platform’s culture. Polished ads underperform significantly.
Instagram remains vital for brand retention and higher AOV conversions. It is not a volume channel but a trust channel. A blended approach outperforms single-channel strategies by leveraging the strengths of each platform. TikTok brings the traffic; Meta converts the trust.
What We Would Do Differently Today
Looking back, there are two areas where we would refine our approach. First, we would have started the creative refresh earlier. The first two weeks were lost to infrastructure setup, which delayed the start of the actual A/B testing. In future projects, we would parallelize infrastructure and creative production to save time. Second, we would have tested a 80/20 budget split earlier. The 50/50 split was a safe starting point, but the data clearly favored TikTok. A more aggressive initial tilt could have accelerated the CAC reduction.
The Path Forward
We recommend re-evaluating the channel mix quarterly. Creative testing velocity matters more than static budget allocation. Platforms evolve quickly, and what works today may not work in three months. By maintaining a dynamic testing culture, the client can continue to optimize their CAC and ROAS, ensuring sustainable growth in a competitive D2C landscape.