The Operational Bottleneck in Stockholm
For many established B2B IT service providers, growth brings a paradox: the more data you generate, the harder it becomes to make sense of it. Our client, a well-regarded IT service provider based in Stockholm with a team of 150 employees, found themselves trapped in this cycle. While their client acquisition strategies were performing well, the internal visibility into those efforts was lagging significantly behind. The primary pain point was not a lack of data, but a lack of trust in the data that was available. Every month, the finance and operations teams faced a grueling process of manual reconciliation to produce the KPI reports that leadership relied on for strategic decisions. This process was not just tedious; it was a critical bottleneck that delayed insight by up to two weeks, rendering real-time decision-making impossible in a fast-paced tech market.
The Challenges
The core issue was not a single broken tool, but a fragmented ecosystem where data lived in silos. We identified three specific structural challenges that were driving the inefficiency. First, there was severe data dispersion. Lead generation data resided in HubSpot, deal stage and revenue data in Salesforce, and customer support sentiment in Zendesk. There was no single source of truth, forcing analysts to manually export, clean, and merge these disparate datasets. Second, the manual process was a significant time sink. The finance team spent three full days every month engaging in copy-paste actions and complex Excel formulas to bridge the gaps between systems. This represented a substantial opportunity cost, diverting skilled financial analysts from high-value strategic work to low-value data entry. Third, the latency of the data created a dangerous blind spot. Management was making quarterly budget allocations and hiring decisions based on data that was, on average, 14 days old. In the IT services sector, where project margins and client churn can shift rapidly, this delay meant that corrective actions were often taken too late.
The Tech Stack
To solve this, we moved away from a custom-coded, heavy-lift solution and instead leveraged a modern, low-code integration stack that prioritized speed and maintainability. The tools selected were specifically chosen for their compatibility and the existing licenses the client already held.
- HubSpot: Served as the primary source for marketing-qualified leads and initial customer interaction data.
- Salesforce: Provided the authoritative data for opportunity stages, closed-won revenue, and account hierarchy.
- Zendesk: Contributed support ticket volumes and resolution times to calculate customer satisfaction and churn risk indicators.
- Zapier: Acted as the middleware layer, handling the API connections, data transformation, and error logging between the source applications and the BI tool.
- Looker Studio: Functioned as the visualization layer, allowing for the creation of interactive, real-time dashboards accessible to stakeholders without requiring SQL knowledge.
How We Measured It
Before writing a single line of configuration, we established a baseline to ensure that the project’s success could be quantified objectively. We worked with the finance team to audit the last three months of manual reporting logs. This allowed us to calculate the precise average hours spent on data retrieval, cleaning, and report assembly. We also conducted a spot-check audit of the previous quarter’s reports, comparing the final figures against the raw source data to determine the baseline error rate, which we found to be approximately 15%. Furthermore, we tracked the timestamp of the last data update in the manual reports to establish the average latency period. These three metrics—time spent, error rate, and data latency—became the primary KPIs for measuring the success of the automation project. By defining these baselines upfront, we avoided the common pitfall of vague success criteria and ensured that the business case for the project remained solid throughout the implementation.
Implementation: From Silos to Stream
The implementation phase was structured into four distinct weeks, each with a specific focus to minimize risk and ensure smooth adoption. The first week was dedicated to data mapping and KPI definition. We did not attempt to automate every possible metric. Instead, we sat down with the management team to identify the 12 core KPIs that actually drove decision-making, such as Customer Acquisition Cost (CAC), Lifetime Value (LTV), Churn Rate, and Pipeline Conversion. This focus was critical; by limiting the scope to these 12 metrics, we prevented the project from becoming an unmanageable data dump.
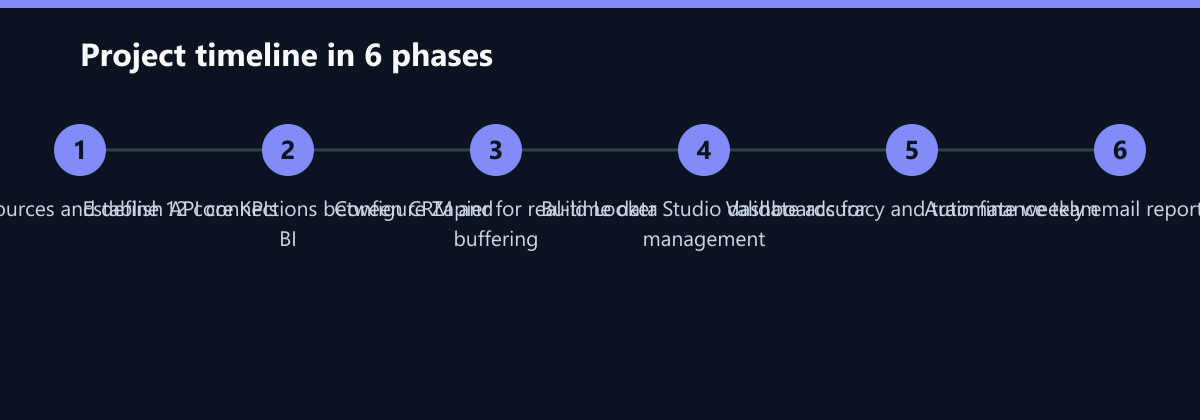
In the second week, we established the technical backbone. We configured Zapier to pull data from HubSpot, Salesforce, and Zendesk at 15-minute intervals. This intermediate buffer was crucial because it allowed us to normalize data formats and handle API rate limits without overloading the source systems. The data was then pushed into a centralized BigQuery dataset, which served as the single source of truth. The third week focused on visualization. We built the Looker Studio dashboards, ensuring that the layout was intuitive for non-technical stakeholders. We created distinct views for the CEO, the CTO, and the Finance Director, each highlighting the specific metrics relevant to their role. The fourth week was reserved for validation and training. We ran the automated system in parallel with the manual process for one full cycle. This “shadow mode” allowed us to compare the automated outputs against the manual ones, identifying and correcting any discrepancies in data logic or calculation formulas. Once the accuracy was confirmed, we conducted training sessions for the finance team, empowering them to make minor adjustments to the dashboards themselves.
The Impact on Operations
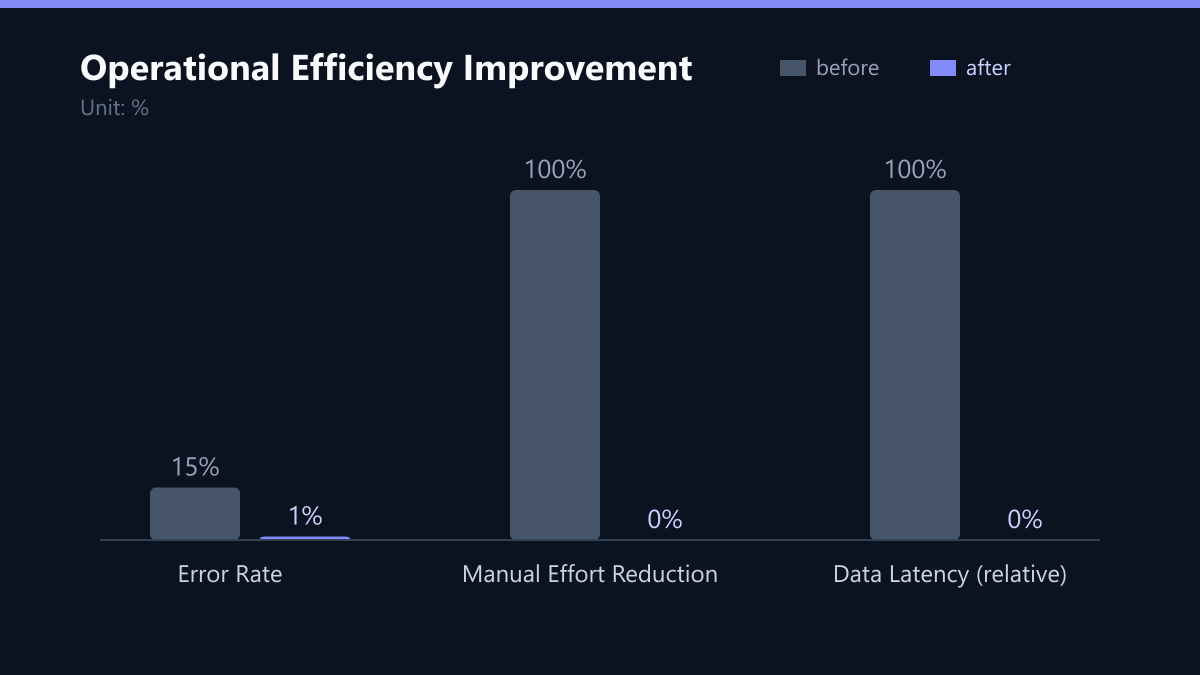
The results of the implementation were immediate and tangible. The most significant change was the elimination of the monthly reporting burden. The 40 hours previously spent on manual data reconciliation were reduced to zero. The finance team no longer needed to spend three days each month on Excel formulas and copy-paste actions. Instead, they received automated, validated reports directly in their inboxes. This freed up approximately 260 hours of productive time annually, which the team redirected toward strategic financial planning and client profitability analysis.
Beyond time savings, the quality of the data improved dramatically. By removing the human element from data entry and transformation, the error rate plummeted from 15% to less than 1%. This increase in data integrity gave leadership the confidence to make faster, more informed decisions. The data freshness also shifted from a two-week delay to real-time availability. Managers could now see the impact of a new marketing campaign or a change in sales tactics within hours, rather than waiting for the next monthly report. This agility allowed the company to pivot strategies more quickly, directly impacting revenue growth and customer retention.
The financial impact was also notable. While the primary goal was time savings, the secondary effect was a reduction in operational overhead. The cost of maintaining the automated stack was a fraction of the labor cost previously associated with manual reporting. Furthermore, the improved visibility into CAC and LTV allowed the sales and marketing teams to optimize their spend more effectively, leading to a more efficient allocation of the marketing budget. The client reported that the ability to see real-time pipeline health helped them forecast revenue more accurately, reducing the variance between forecasted and actual results by a significant margin.
Lessons Learned
The success of this project hinged on several key factors that we believe are applicable to any B2B organization looking to modernize their reporting. First, the clear definition of KPIs before technical implementation was non-negotiable. Without this prioritization, the project would have likely expanded in scope, becoming a bloated data project that failed to deliver clear value. By focusing on 12 core KPIs, we ensured that the solution remained lean and relevant. Second, early stakeholder involvement was crucial. By engaging the finance team from the very first week, we ensured that their specific pain points were addressed and that they felt ownership over the new system. This buy-in was essential for the long-term adoption of the dashboards. Third, the choice of a low-code stack like Zapier and Looker Studio proved to be a strategic advantage. It allowed for a faster time-to-value and made the system easier to maintain and scale.
What We Would Do Differently Today
Despite the success of the project, there are areas where we would refine our approach if we were to repeat the engagement today. First, we would have invested more time in data hygiene before starting the integration. While the automation solved the reporting problem, it highlighted underlying issues with data consistency in the source systems, such as inconsistent naming conventions for clients across HubSpot and Salesforce. A more rigorous data cleanup phase prior to integration would have resulted in a smoother rollout and fewer edge cases to handle during the validation phase. Second, we would have introduced a more formal change management process for the end-users. While we provided training, some team members were hesitant to rely on the new automated reports, preferring their old Excel templates out of habit. A more structured communication plan, highlighting the specific benefits for each user group, could have accelerated adoption. Finally, we would have documented the data lineage more thoroughly from the outset. While the system is now stable, having a clear map of how each data point flows from source to dashboard would make future troubleshooting and updates even more efficient.
Scalability and Future Outlook
The solution implemented for this Stockholm-based IT service provider is not a one-off fix but a scalable foundation. The architecture is designed to easily accommodate additional data sources as the company grows. For instance, the client is currently exploring the integration of their project management tools to provide a more holistic view of resource utilization and project profitability. Furthermore, the setup is ready to be rolled out to the client’s subsidiaries in Norway and Denmark. By standardizing the KPI definitions and the technical stack, the company can ensure consistency in reporting across its entire Nordic operation. This cross-border scalability is a significant advantage, as it allows for a unified view of performance across different markets, facilitating better resource allocation and strategic planning at the group level. The success of this project demonstrates that with the right focus on core metrics and the right tooling, even complex data challenges can be solved with a lean, efficient, and cost-effective solution.
Passend dazu
- Performance Marketing
- RevOps & Reporting
- Affiliate Marketing
- Content & CRO
- B2B Industry: 34% CPA Reduction through Dynamic Google Ads Campaigns and HubSpot Attribution in the DACH Region
- Reduktion der Amazon Advertising ACOS um 18 % durch dynamische Bid-Regeln
- 30% Effizienzgewinn durch A/B-getestete Landing Pages und automatisierte Follow-up-E-Mails
- CRM Hygiene Project in the DACH Region: 40% Reduction in Duplicates and 10% Increase in Open Rate through Deduplicated Campaigns
- Social Ad Fatigue Prevention in Scandinavia: CPC Stabilization over 6 Months through Creative Rotation
- Influencer collaboration in B2B: Measurable ROI increase through LinkedIn Top Voices for a Scandinavian industrial conglomerate