The Strategic Imperative
When a mid-sized B2B SaaS provider with 150 employees based in the DACH region decided to expand into Singapore and Japan, they faced a critical operational bottleneck. The growth strategy relied heavily on local affiliate partners, but the existing reporting infrastructure was ill-equipped to handle the complexity of multi-market data. The finance department was buried in manual Excel merges, while marketing lacked the visibility to make data-driven decisions. The core issue was not a lack of data, but a lack of accessible, real-time insight. Without a unified view, it was impossible to determine which partners were truly profitable and which were draining resources.
The situation was exacerbated by the time lag in data processing. Leads generated by affiliates in Asia were taking up to five days to appear in the financial reports. In a competitive SaaS market where speed to lead is critical, this delay was unacceptable. Marketing teams could not react to poor performance or double down on successful channels in real-time. The goal was clear: eliminate manual reporting, integrate affiliate data directly into the central revenue dashboard, and enable transparent ROI management for both new markets.
The Challenges
Despite the clear goal, the implementation faced several specific hurdles that required careful planning:
- Data Fragmentation: Affiliate networks in Singapore and Japan used different data structures and update frequencies. Standardizing these into a single CRM schema was a significant technical challenge.
- Attribution Complexity: Unlike direct sales, affiliate leads often involve multiple touchpoints. Determining which partner deserved the commission required a robust attribution model that aligned with the company’s sales cycle.
- Cultural and Time Zone Differences: Coordinating between the DACH headquarters and Asian partners across different time zones made real-time troubleshooting difficult during the initial setup phase.
- Legacy System Constraints: The existing CRM had limited API capabilities, requiring a middleware layer to handle the high volume of incoming data without causing performance bottlenecks.
The Tech Stack
To overcome these challenges, we deployed a lean but robust technology stack:
- Middleware Layer: A custom-built API connector to handle data normalization and error handling between the affiliate networks and the CRM.
- CRM System: The central hub for customer and lead data, extended with new fields for affiliate-specific metadata.
- BI Platform: A visualization tool used to build the interactive revenue dashboard, allowing drill-down capabilities per partner and market.
- Data Warehouse: A cloud-based storage solution to retain historical data for trend analysis and long-term ROI tracking.
- Alerting System: Automated notifications triggered when KPIs breached predefined thresholds, ensuring immediate team awareness.
Implementation
We structured the project into three distinct phases over a six-week period, ensuring that each step built upon a stable foundation. The technical core was the middleware connection, which acted as the bridge between the external affiliate networks and the internal CRM system.
Phase 1 (Weeks 1-2): Data Integration & Standardization
The first phase focused on establishing a reliable data pipeline. We mapped the data fields from the affiliate networks (clicks, conversions, commissions) to the corresponding fields in the CRM. This involved significant effort in standardizing data formats, particularly regarding currency conversion and time zone normalization. We established a strict validation protocol to ensure that every record entering the CRM was complete and accurate. This step was crucial because any errors here would propagate through the entire reporting chain.
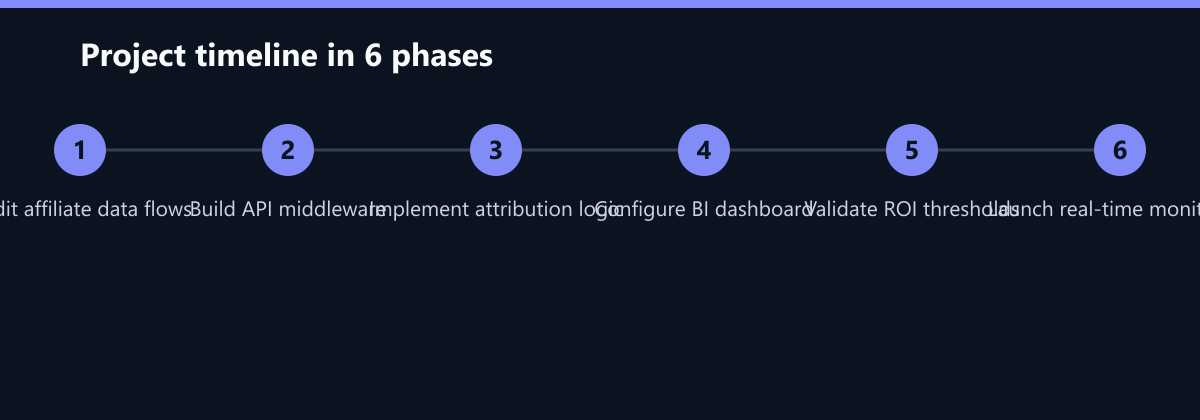
Phase 2 (Weeks 3-4): Attribution Logic & Sales Alignment
With the data flowing, we developed the logic for lead attribution. This was not just a technical task but a business process alignment. We worked closely with the regional sales teams in Singapore and Japan to define how leads should be assigned. The system was configured to automatically route affiliate leads to the specific sales reps responsible for that region and industry vertical. We also implemented the commission threshold logic, defining clear “green,” “amber,” and “red” zones for partner performance based on historical data.
Phase 3 (Weeks 5-6): Dashboard Development & Validation
The final phase involved building the user interface in the BI tool. The dashboard was designed to be intuitive, with high-level KPIs visible at a glance and detailed breakdowns available on click. We created specific views for the marketing team (focused on CTR and cost per lead) and the finance team (focused on net revenue and commission payout). Before go-live, we ran a parallel testing period for one week, comparing the new dashboard data with the old manual Excel reports to ensure 100% accuracy.
How We Measured It
To ensure the solution delivered on its promises, we established a rigorous measurement framework. We did not rely on self-reported savings but instead tracked hard operational metrics.
- Time-to-Insight: We measured the time from lead generation in the affiliate network to the point where that lead appeared in the financial dashboard. This was tracked via automated timestamps in the data pipeline.
- Manual Effort: We conducted a time-motion study with the finance team before and after implementation. We recorded the exact hours spent on data merging, cleaning, and report generation. The baseline was established over a two-week period prior to the project start.
- Partner Revenue Contribution: We analyzed the revenue attribution data to determine the Pareto distribution of partner performance. This allowed us to quantify the concentration of revenue among the top partners.
Results
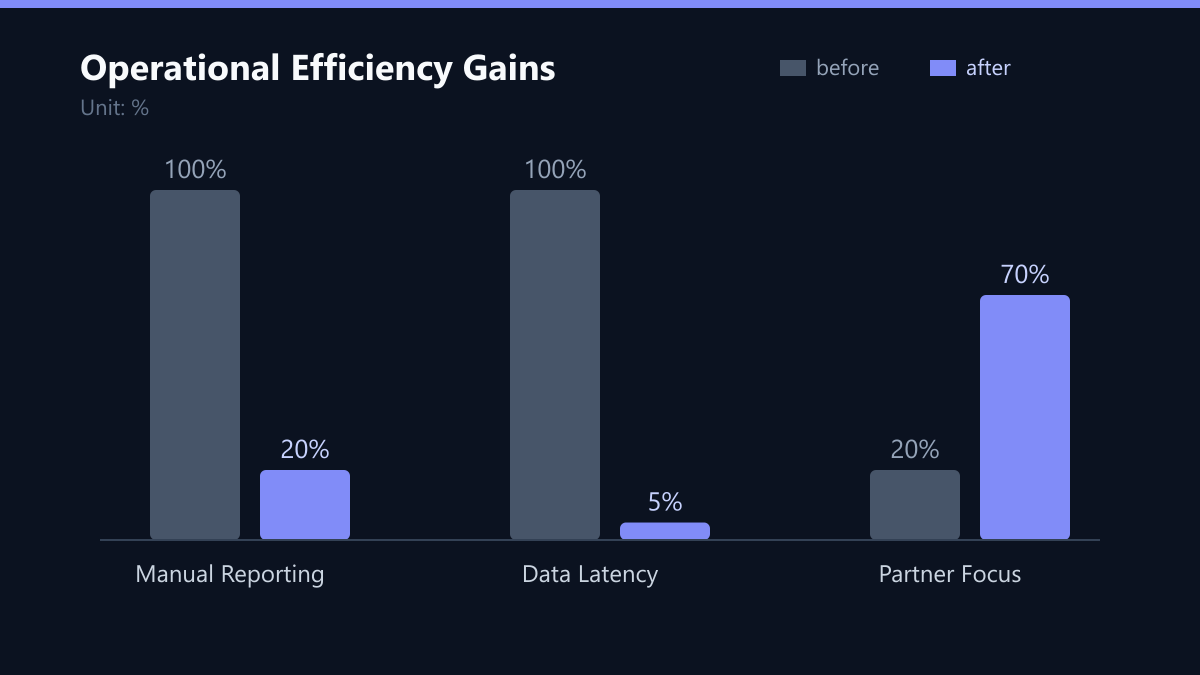
The impact of the implementation was immediate and measurable. The most significant change was the elimination of the manual reporting burden. The finance team no longer needed to spend days merging Excel files. Instead, the dashboard provided an automated, real-time view of affiliate performance.
The time from lead generation to financial evaluation dropped from five days to under 24 hours. This reduction in latency was transformative. It allowed the marketing team to identify underperforming partners within a day and adjust their strategy accordingly. For example, if a partner in Japan was driving high traffic but low-quality leads, the team could pause the campaign within 48 hours, saving potential wasted ad spend.
Furthermore, the new visibility revealed a stark concentration in partner performance. The data showed that the top 20 partners were generating 70% of the total revenue from the affiliate channel. This insight allowed the company to focus its relationship management efforts on these key accounts, while deprioritizing or restructuring partnerships with low-performing partners. The “traffic light” system in the dashboard made this prioritization visual and objective, reducing subjective debates in budget meetings.
Lessons Learned
The success of this project was not just technical; it was organizational. The close collaboration between marketing and finance from day one was the decisive factor. Both departments agreed on a single source of truth, which eliminated the common “two sets of numbers” problem. However, there were also areas where we learned valuable lessons.
- Data Quality is Non-Negotiable: We found that even small inconsistencies in the affiliate network’s data (such as missing UTM parameters) could significantly skew the attribution model. We had to invest extra time in upstream data quality checks, which is often underestimated in project planning.
- Agility Requires Trust: Real-time data is only useful if teams trust it and are empowered to act on it. We spent time training the regional teams on how to interpret the dashboard and what actions to take when thresholds were breached. This change management aspect was as important as the technical build.
- Scalability is Key: The architecture was designed with future growth in mind. The modular nature of the middleware means that adding new Asian markets in the future will require minimal additional effort, making this a sustainable long-term investment.
What We Would Do Differently Today
Looking back, there are two areas where we would refine our approach if we were to restart the project.
- Phased Rollout: We implemented the solution for both Singapore and Japan simultaneously. In hindsight, a phased rollout—starting with one market to fine-tune the logic—might have reduced the complexity of the initial go-live and allowed for a smoother transition.
- Earlier Stakeholder Involvement: While we involved marketing and finance, we could have involved the sales operations team even earlier in the attribution logic design. Their input on lead qualification criteria would have helped refine the routing rules and reduced the number of misrouted leads in the initial weeks.
Conclusion
Integrating affiliate data into a central revenue dashboard is no longer a nice-to-have; it is a strategic necessity for companies expanding into complex, multi-market environments. For this B2B SaaS provider, the investment in real-time visibility paid for itself almost immediately through the reduction in manual labor and the ability to optimize partner spend. The result was not just a better report, but a more agile, data-driven organization capable of competing effectively in the fast-paced Asian market.
Passend dazu
- Performance Marketing
- SEO & AI Search (GEO)
- Ad Extensions in the Mid-Market: Which Extensions Really Increase CTR
- High-Impact Ad Extensions to Lower CPC in B2B SaaS
- Affiliate Marketing
- Content & CRO
- CRM Marketing
- Automated Campaign Management: 40% ROAS Increase for a DACH Industrial Supplier through Dynamic Budget Allocation in Amazon DSP
- Cross-Channel Reporting for Fintech in Asia
- Global Affiliate Expansion: Multilingual Campaigns and ROI Optimization for Tech Companies in Asia
- Reduction of Manual Data Entry by 90 Percent through API Integrations in the Asian Logistics Sector
- Scaling Campaign Management to Three New Markets in 60 Days
- Short Video Production for Mid-Market: DIY Setups Under 500 Dollars