The Strategic Imperative: Breaking the Manual Bottleneck
For a mid-sized food production company in Southern Italy with 45 employees, the decision to expand into France, Spain, and Portugal was a critical growth milestone. However, the marketing infrastructure supporting this expansion was severely outdated. The team relied on static spreadsheets and disjointed email tools, creating a fragmented view of customer interactions. This manual approach consumed approximately 60 percent of the marketing team’s weekly hours, leaving little time for strategic planning or creative development.
The core issue was scalability. The existing process could not support personalized outreach across three distinct linguistic and cultural markets simultaneously. Without real-time visibility into user behavior, the team struggled to qualify leads effectively. Sales representatives were overwhelmed by a high volume of low-quality inquiries, many of which lacked the necessary context for a meaningful conversation. The strict 60-day deadline to launch in all three new markets made it impossible to continue with the status quo. The organization needed a system that could not only handle the volume but also adapt dynamically to local market nuances.
The Challenges
Several specific hurdles threatened the timeline and success of the expansion:
- Data Fragmentation: Customer data was siloed across web forms, e-commerce platforms, and trade show sign-up sheets. There was no single source of truth, leading to duplicate records and inconsistent communication.
- Lack of Behavioral Insight: The team could not track post-click behavior. Without data on content downloads or webinar attendance, lead qualification was based on guesswork rather than demonstrated interest.
- Regional Complexity: France, Spain, and Portugal have different GDPR interpretations, language preferences, and buying cycles. A one-size-fits-all email template was ineffective and risked brand damage.
- Sales-Marketing Misalignment: Sales teams did not have clear criteria for what constituted a “qualified” lead, resulting in a high rejection rate of marketing-sourced opportunities and frustration on both sides.
The Tech Stack
To address these challenges, we deployed a centralized marketing automation stack integrated directly with the client’s existing CRM. The following tools formed the core of the solution:
- Marketing Automation Platform: Served as the central hub for journey orchestration and email delivery.
- CRM System: The system of record for all customer interactions and sales pipeline management.
- Slack Integration: Enabled real-time notifications for high-priority leads to the sales team.
- A/B Testing Engine: Built into the automation platform to optimize subject lines and content variations.
Implementation: A Three-Phase Approach
The implementation followed a strict three-phase timeline to ensure rapid deployment within the 60-day window. The focus was on building scalable journey templates and dynamic lead scoring models that could be replicated across regions.
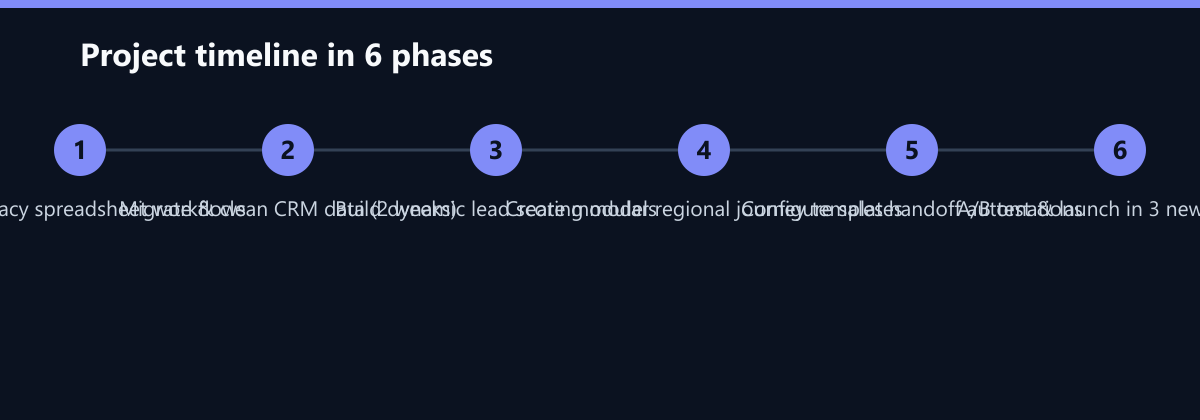
Phase 1: Data Migration and Hygiene (Weeks 1–2)
The first two weeks were dedicated to unifying customer data. We migrated data from web forms, e-commerce, and trade shows into the CRM. This involved deduplication, standardizing fields, and ensuring compliance with local data protection regulations. The goal was to establish a clean, single source of truth before any automation was triggered.
Phase 2: Automation and Scoring Logic (Weeks 3–4)
With clean data in place, we built the automated email journeys and lead scoring logic. We implemented a behavior-based scoring model that weighted specific actions, such as price list downloads, webinar attendance, and email opens. Simultaneously, we created modular regional journey templates. These templates automatically adapted content based on the lead’s country and language preference, ensuring relevant messaging without manual intervention.
Phase 3: Testing and Launch (Weeks 5–6)
The final two weeks were reserved for A/B testing and full-scale launch preparation. We tested subject lines and call-to-action buttons for each market. We also configured the sales handoff automation, setting up instant Slack and CRM notifications for high-scoring leads. This phase ensured that the system was stable and that the sales team was ready to receive qualified leads.
How We Measured It
To determine the impact of the implementation, we established baseline metrics before the launch. We tracked campaign setup time by logging the hours spent on manual configuration in the previous quarter. Lead response time was measured from the moment a lead was created in the CRM to the first sales contact. Qualified lead rate was defined by the percentage of leads that moved to the “Qualified” stage in the CRM without being rejected by sales. Manual data entry was tracked by auditing the time spent on duplicate record resolution and data cleanup.
Results: From Chaos to Controlled Growth
The automated system allowed the team to manage three new markets without increasing headcount. The shift from manual to automated processes yielded immediate and measurable improvements in efficiency and quality.
Campaign execution time dropped significantly. What previously took 12 hours per campaign now took only 2 hours, an 83 percent reduction. This freed up the marketing team to focus on strategy and creative development rather than administrative tasks. Lead response time improved from an average of 48 hours to just 4 hours. This rapid response was critical in new markets where competitors were also aggressive in their outreach.
Lead quality improved markedly due to the precision of the new scoring model. The qualified lead rate increased from 15 percent to 24 percent, a 40 percent relative increase. This meant that sales teams were spending their time on prospects who were genuinely interested and had the potential to convert. Manual data entry dropped from 20 hours per week to just 2 hours, as the automated deduplication and synchronization processes handled the bulk of the work.
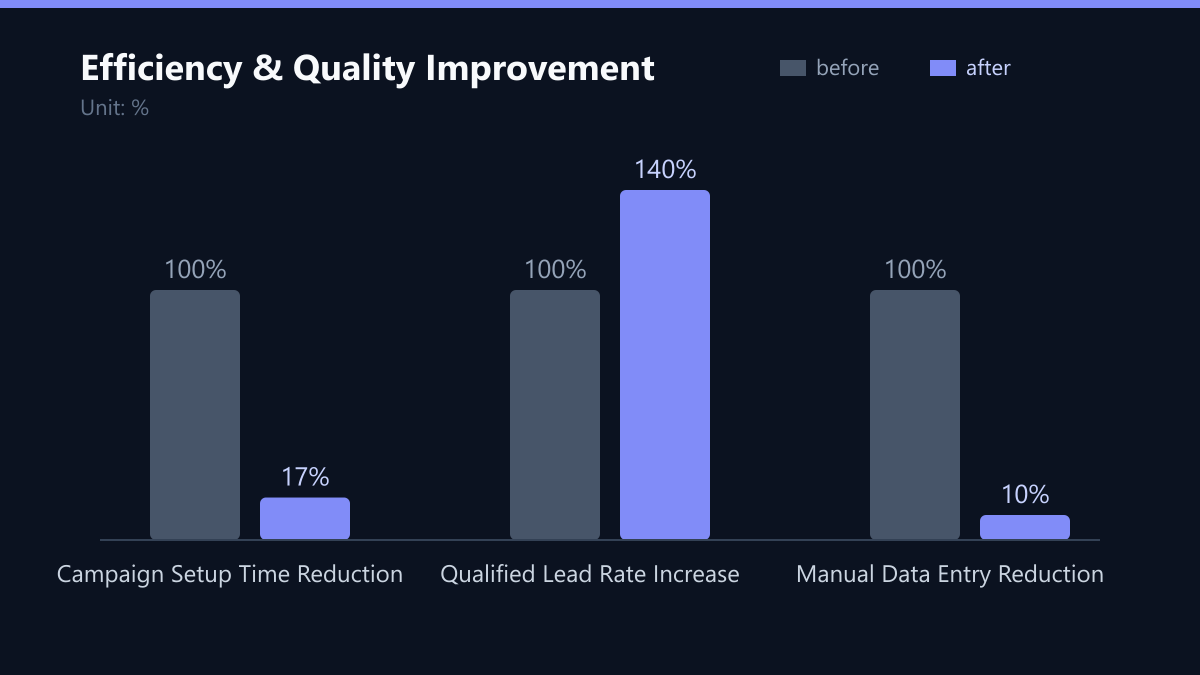
| Metric | Before Automation | After Automation |
|---|---|---|
| Campaign Setup Time | 12 hours per campaign | 2 hours per campaign |
| Lead Response Time | 48 hours | 4 hours |
| Qualified Lead Rate | 15 percent | 24 percent |
| Manual Data Entry | 20 hours per week | 2 hours per week |
Lessons Learned
Standardization is the key to rapid international expansion. Building modular journey templates allowed for quick adaptation to local regulations and language nuances. However, lead scoring must be tested continuously to remain accurate in new markets. The initial scoring thresholds required adjustment after the first two weeks of live data. We found that certain behaviors, such as webinar attendance, were weighted too heavily in the initial model, leading to false positives. We recalibrated the weights based on actual conversion data from the new markets.
Close collaboration between marketing and sales is essential for defining qualification criteria. We held weekly syncs during the implementation phase to align on what constituted a “qualified” lead. This alignment reduced friction and ensured that sales teams trusted the leads they were receiving. The 60-day timeline was achievable only because of pre-configured automation blocks. Without these standardized components, the project would have taken significantly longer. This project demonstrates that infrastructure built for scale prevents operational chaos during growth phases.
What We Would Do Differently Today
While the project was a success, there are areas where we could improve the process:
- Earlier Sales Involvement: We would involve sales teams in the design of the lead scoring model from day one. This would reduce the need for post-launch adjustments and ensure higher buy-in from the sales organization.
- Granular A/B Testing: We would implement more granular A/B testing for individual email elements, such as images and button colors, rather than just subject lines. This could have further improved open and click-through rates.
- Post-Launch Optimization Cadence: We would establish a more formal post-launch optimization cadence. While we adjusted the scoring model after two weeks, a continuous improvement loop with regular reviews would have ensured long-term performance stability.