Why Data Beats Intuition on Amazon
Amazon’s search algorithm, A9, prioritizes relevance and conversion. Without structured testing, you rely on intuition rather than data. A/B testing isolates specific variables to determine what drives sales. This approach reduces wasted ad spend and improves organic ranking. It creates a repeatable process for continuous improvement. For mid-market brands, moving from guesswork to a standardized testing protocol is often the single most effective way to improve profitability without increasing budget. By systematically validating changes, you ensure that every dollar spent on advertising is directed toward the most effective creative and targeting combinations.
Optimizing Product Detail Pages (PDP)
The product page is the primary conversion driver. Focus on elements that directly influence buyer confidence. Main Image is the most critical factor. Test high-contrast backgrounds or lifestyle shots against plain white. A common baseline to start with is a 10% lift in click-through rate when switching from a generic white background to a contextual lifestyle image. Title Structure impacts click-through rate from search results. Place the brand name after the core keyword. Bullet Points should highlight benefits, not just features. Use bold formatting for key selling points. A+ Content allows for brand storytelling. Test different module layouts. Price Presentation can be tested via coupons or direct pricing. Ensure the perceived value matches the price point. When testing price presentation, be cautious of long-term brand perception; a temporary coupon test can reveal price sensitivity without permanently altering the list price.
Refining Sponsored Products and Display Ads
Advertising drives traffic, but only if the creative and targeting align. Creative Assets for Sponsored Display require testing. Compare static images against video ads. Video ads often show higher engagement but may have higher production costs; a typical configuration for mid-market brands involves testing one high-quality video against three static variants to balance cost and impact. Headlines in Sponsored Brands campaigns affect CTR. Test benefit-driven vs. feature-driven headlines. Targeting Strategy needs continuous validation. Test broad match against exact match for core keywords. Bid Strategy impacts placement. Test top-of-search bids versus product page placements. Negative Keywords prevent wasted spend. Regularly review search term reports to add negatives. A standard workflow involves reviewing search term reports every Monday to identify irrelevant queries from the previous week, adding them as negative keywords to stop wasted spend immediately.
Key Metrics for Statistical Significance
Do not judge tests based on daily fluctuations. Conversion Rate (CR) is the primary metric for PDPs. Click-Through Rate (CTR) is the primary metric for ads. Return on Ad Spend (ROAS) measures efficiency. Cost Per Acquisition (CPA) tracks profitability. Ensure your sample size is sufficient. Use a statistical calculator to determine required impressions. A minimum of 95% confidence level is standard. Avoid stopping tests early due to early wins. This leads to false positives. Let the test run for a full cycle, usually two to four weeks.
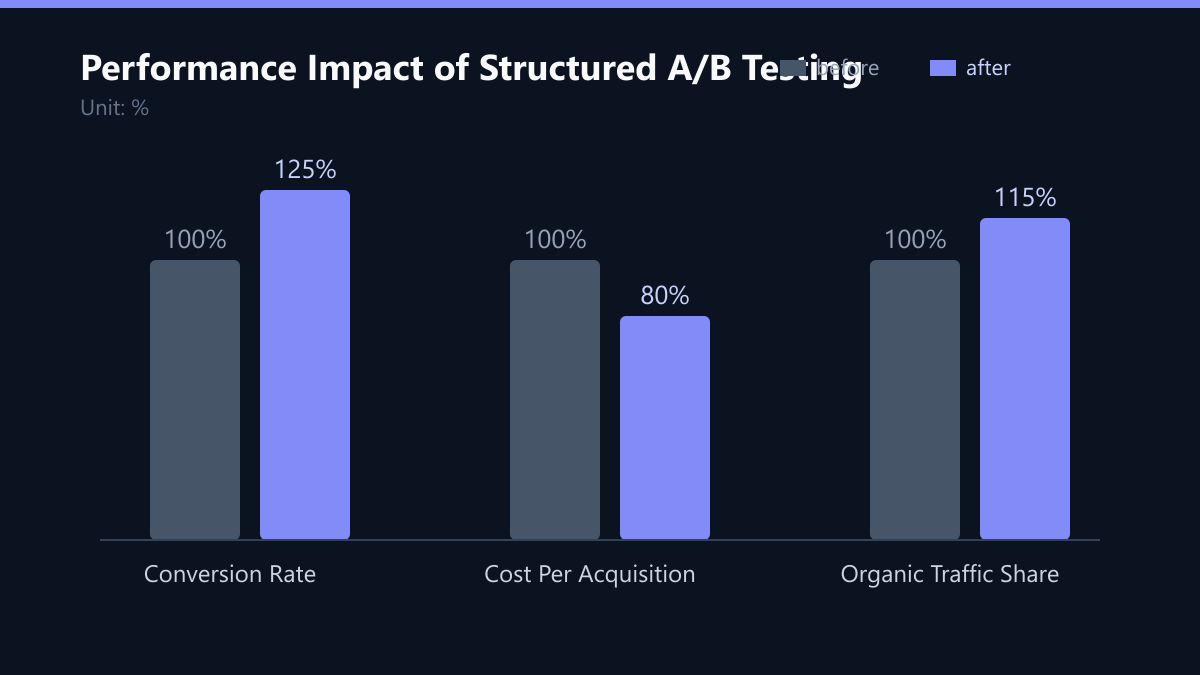
Understanding the relationship between these metrics is crucial. For example, if CTR increases but CR decreases, your ad is attracting the wrong audience. If CR increases but CPA remains high, your bids may be too aggressive. The following table illustrates a typical scenario where structured testing improves efficiency:
| Metric | Baseline (Control) | After Testing (Variant) | Change |
|---|---|---|---|
| Conversion Rate | 12.0% | 15.0% | +25% |
| Cost Per Acquisition | €50.00 | €40.00 | -20% |
| Organic Traffic Share | 40% | 46% | +6% |
Implementation Workflow for Mid-Market Teams
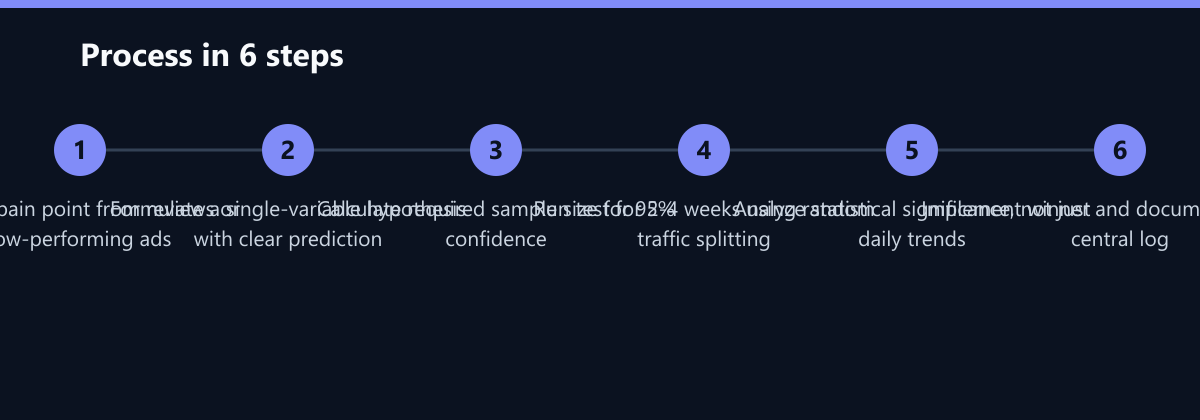
A structured workflow ensures consistency. 1. Hypothesis Generation: Identify a pain point. Use customer reviews or low-performing ad groups. 2. Variable Selection: Change only one element at a time. Multiple variables make results inconclusive. 3. Duration Setting: Define the test length in advance. Account for seasonality and day-of-week effects. 4. Execution: Use Amazon Manage Your Experiments or third-party tools. Ensure traffic splitting is random. 5. Analysis: Compare control and variant performance. Check for statistical significance. 6. Implementation: Roll out the winning variant. Document the result for future reference. This workflow reduces decision fatigue and ensures that every test contributes to a growing library of proven insights. For teams without dedicated data scientists, using pre-configured templates for common tests (e.g., image swap, headline change) can reduce setup time from hours to minutes.
Typical Mistakes That Invalidate Data
Even with the best tools, process errors can ruin results. Here are the most common pitfalls to avoid:
- Peeking at Results Early: Checking daily results and stopping the test when you see a “win” is a classic error. This violates statistical assumptions and often leads to false positives. Always wait for the pre-determined end date or sample size.
- Ignoring Mobile Traffic: Most Amazon traffic is mobile. If your creative looks good on desktop but is unreadable on mobile, your test data will be skewed. Always preview your assets on a mobile device before launching.
- Testing During Anomalies: Running a test during a major sale event like Prime Day or Black Friday introduces massive noise. Seasonal spikes in traffic and conversion behavior will mask the true effect of your variable. Schedule tests during normal trading periods.
- Lack of Documentation: Without a central log, you repeat the same tests. Maintain a spreadsheet or database that records the hypothesis, duration, sample size, and result for every test. This “institutional memory” is invaluable for long-term optimization.
How You Measure Success
Success is not just about a single winning test; it is about the cumulative impact on your P&L. To measure the effectiveness of your A/B testing program, track these KPIs:
- Test Velocity: The number of valid tests completed per month. Aim for at least 2-3 tests per month for active SKUs.
- Win Rate: The percentage of tests that show a statistically significant improvement. A healthy win rate is 40-60%. If it is lower, your hypotheses may be too risky; if higher, they may be too obvious.
- Cumulative Revenue Lift: The total additional revenue generated by implemented winning variants. Track this quarterly to demonstrate ROI to stakeholders.
- CPA Reduction: The average decrease in Cost Per Acquisition over time due to optimized ads and landing pages.
To calculate the ROI of your testing program, compare the cost of the testing effort (staff time, tool subscriptions) against the cumulative revenue lift. A typical mid-market brand can expect a 5-10x return on investment within the first year of implementing a rigorous A/B testing culture.
Checklist for Launching Your First Test
Before you launch, ensure you have completed these steps:
- Identify a single, specific variable to test.
- Write a clear hypothesis (e.g., “Changing the main image to a lifestyle shot will increase CR by 10%”).
- Calculate the required sample size using a statistical calculator.
- Set the start and end dates, ensuring no major sales events overlap.
- Verify that the traffic splitting mechanism is random and consistent.
- Prepare a dashboard to track key metrics daily without interfering with the test.
- Assign an owner to the test and set a reminder for the analysis date.
By following this checklist, you eliminate the most common sources of error and set your test up for success. Consistency is key. The brands that win on Amazon are not those that make the best guesses, but those that learn the fastest through disciplined, data-driven experimentation.
Passend dazu
- HubSpot CRO: 32% Increase in Demo Bookings through A/B Testing of Landing Pages for a DACH Industrial Provider
- Performance Marketing
- 30% Effizienzgewinn durch A/B-getestete Landing Pages und automatisierte Follow-up-E-Mails
- Reduktion der Amazon Advertising ACOS um 18 % durch dynamische Bid-Regeln
- Marketplace & Amazon Ads
- Affiliate Marketing
- Content & CRO
- HubSpot CRO: Effective Landing Page Testing Without Developer Support
- A/B Testing in Practice: Calculating Significance and Sample Size Correctly
- Dynamic Product Ads for Long-Tail B2B Lines in Benelux