The Starting Point: Traffic Without Transformation
In the industrial automation sector, generating awareness is often the easier part of the marketing equation. Our client, a DACH-based provider with 450 employees, had mastered the art of inbound attraction. Their SEO and paid media strategies delivered a steady stream of organic and paid traffic to their website. However, a critical bottleneck had emerged: this traffic was not converting into pipeline. Despite significant ad spend, demo bookings remained stagnant, and the sales team was struggling to qualify enough leads to meet quarterly targets.
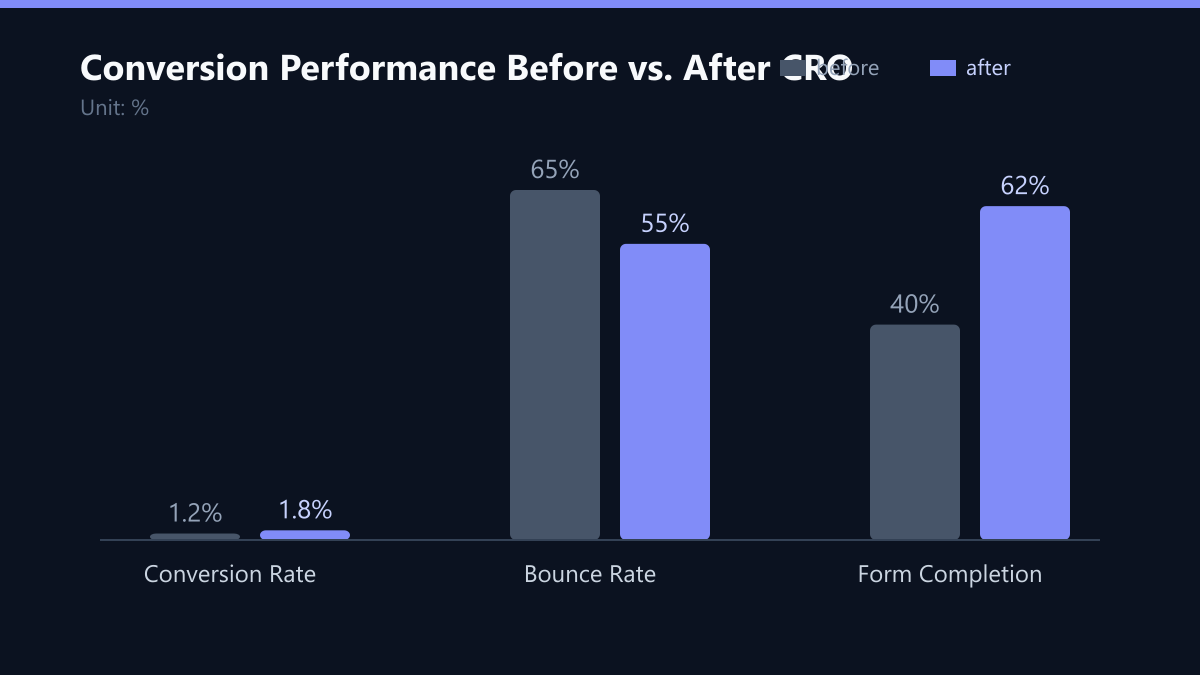
The core issue was not a lack of interest, but a lack of relevance. The landing pages were designed with a “one-size-fits-all” approach, featuring generic branding and broad value propositions. For a B2B audience dealing with complex technical challenges, this generic messaging failed to resonate. Visitors landed on pages that looked professional but did not speak to their specific pain points. The data painted a clear picture of friction: a 65% bounce rate on key landing pages and a conversion rate of just 1.2% to demo request. Every click was a potential opportunity lost to poor user experience and vague messaging.
The Challenges We Faced
Before diving into implementation, we identified three specific hurdles that had previously hindered conversion efforts. First, the lack of segmentation in messaging. The same landing page was used for all traffic sources, whether from a technical blog post or a broad brand campaign. This meant that a CTO looking for specific automation solutions was seeing the same copy as a junior procurement officer. Second, excessive form friction. The demo request form required seven fields, including phone number and company size, before the user could even see the value of the solution. In a B2B context where privacy and time are premium, this was a major drop-off point. Third, mobile performance gaps. While 60% of traffic came from mobile devices, the landing pages were not fully optimized for speed and responsiveness, leading to high exit rates on smartphones.
How We Measured It
To ensure that our changes were based on evidence rather than intuition, we established a rigorous measurement framework from day one. We used HubSpot’s native A/B testing tools to track primary and secondary metrics. The primary KPI was the demo booking rate, defined as the number of completed form submissions that resulted in a scheduled call. Secondary metrics included conversion rate (visitors to form completion), bounce rate, and average time on page. We also monitored form abandonment rates at each step to pinpoint exactly where users were leaving. By comparing the control group (the original landing page) against the test variants over a statistically significant period, we could isolate the impact of specific changes, such as headline copy or form length, on overall performance.
The Tech Stack
- HubSpot Marketing Hub: Served as the central platform for A/B testing, form management, and lead tracking.
- Hotjar: Used for heatmap analysis and session recordings to visualize user behavior and identify friction points.
- Google PageSpeed Insights: Utilized to audit and monitor page load times and mobile performance scores.
- HubSpot Service Hub: Integrated to track the handoff from marketing to sales and ensure lead quality metrics were captured.
Implementation: A Structured 12-Week Approach
We adopted a phased, data-driven approach over a 12-week period. The goal was not just to “redesign” the pages, but to systematically test hypotheses about user behavior. The process began with a deep dive into existing data. We analyzed heatmaps and session recordings to understand where users were clicking, scrolling, and abandoning. This diagnostic phase revealed that users were not engaging with the lower sections of the page, where the form was located, because the top-of-page messaging failed to hook them. Furthermore, mobile users were experiencing significant load times, causing them to exit before the content even rendered.
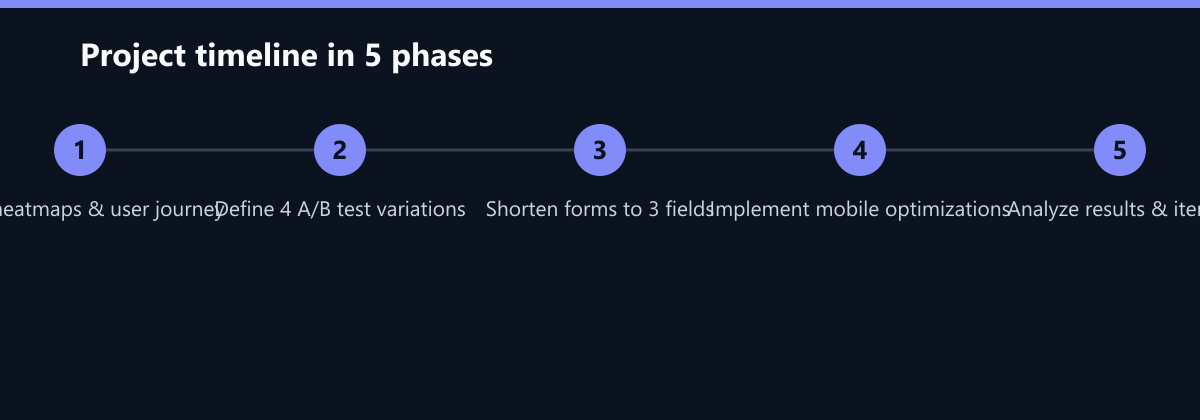
Based on these insights, we moved into the testing phase (Weeks 3-8). We created four distinct variations of the landing page, each testing a specific hypothesis. Variation A focused on headline specificity, replacing generic brand statements with benefit-driven copy that addressed a specific industrial pain point. Variation B tested social proof, moving client success stories and logos directly above the Call-to-Action (CTA) to build trust before asking for commitment. Variation C addressed form friction by reducing the fields from seven to three (Name, Email, Company). Variation D combined the best elements of the previous tests. Throughout this phase, we monitored daily performance to ensure the tests were reaching statistical significance. We found that the combination of specific headlines and reduced form fields yielded the strongest early results.
In the final phase (Weeks 9-12), we shifted focus to technical optimization. We worked with our development team to compress images, minify code, and enable lazy loading, specifically targeting mobile performance. We also replaced stock photography with authentic screenshots and short video clips of the product in action, which increased engagement and time on page. This technical layer was crucial because even the best copy cannot convert if the page takes too long to load on a mobile network.
The Results: Quantifiable Growth
The impact of the 12-week CRO initiative was immediate and sustained. By the end of the third month, the optimized landing pages had significantly outperformed the control group. The most notable shift was in the bottom-line metric: demo bookings increased by 32%. This was not just a volume increase; it was a quality increase. The sales team reported that the new leads were better qualified, citing the specific pain points mentioned in the form as a sign of higher intent.
| Metric | Before | After | Change |
|---|---|---|---|
| Conversion Rate | 1.2% | 1.8% | +50% |
| Avg. Time on Page | 45s | 1m 10s | +55% |
| Demo Bookings/Mo | 18 | 24 | +32% |
| Bounce Rate | 65% | 55% | -15% |
The 50% increase in conversion rate was driven primarily by the reduction in form fields and the clearer value proposition. The average time on page increased by 55%, indicating that users were engaging more deeply with the content, likely due to the more relevant messaging and improved load speeds. The bounce rate dropped by 10 percentage points, suggesting that the page was better aligned with user expectations from the moment it loaded.
Lessons Learned: Specificity Over Branding
This case study highlights a critical insight for B2B industrial marketers: specificity beats generic branding. In a crowded market, users do not care about your brand story unless it is directly tied to solving their problem. The most significant lift came from headlines that spoke to specific outcomes (e.g., “Reduce Downtime by 20%”) rather than abstract brand values (e.g., “Innovation in Automation”). B2B buyers are rational decision-makers who prioritize problem-solving over brand recognition.
We also learned that mobile optimization is not optional. With 60% of traffic coming from mobile devices, the user experience on smartphones is the primary user experience. Neglecting this segment means ignoring the majority of your audience. Finally, CRO is a continuous process. The 12-week project was just the beginning. We have since established a quarterly testing cycle to ensure that the landing pages continue to evolve with changing user behavior and market conditions.
What We Would Do Differently Today
While the results were successful, there are areas where we would refine our approach in future projects. First, we would integrate sales feedback earlier. In this project, we relied heavily on marketing data. Involving the sales team in the initial hypothesis phase would have allowed us to tailor the messaging even more closely to the objections they face during discovery calls. Second, we would prioritize video content more aggressively. While we added short clips, we could have leveraged video testimonials more prominently to build trust faster, especially for high-ticket industrial solutions. Third, we would test exit-intent popups more extensively. Given the high bounce rate, capturing email addresses from users who are about to leave could have provided an additional channel for nurturing, even if they did not book a demo immediately.
Conclusion
For DACH-based industrial providers, the gap between traffic and conversion is often a matter of relevance and friction. By moving from generic branding to specific, problem-solving messaging and by removing unnecessary hurdles in the user journey, significant growth is achievable. This case study demonstrates that with a structured, data-driven approach, even mature B2B companies can unlock new levels of efficiency and growth in their marketing funnels. The key takeaway is that CRO is not a one-time fix but a strategic discipline that requires continuous investment and testing.
Passend dazu
- Performance Marketing
- SEO & AI Search (GEO)
- Affiliate Marketing
- Content & CRO
- CRM Marketing
- Automated Campaign Management: 40% ROAS Increase for a DACH Industrial Supplier through Dynamic Budget Allocation in Amazon DSP
- B2B Industry: 34% CPA Reduction through Dynamic Google Ads Campaigns and HubSpot Attribution in the DACH Region
- CRO im SaaS-Markt UK: 25% niedrigere CAC durch personalisierte Landingpages in Klaviyo
- Influencer Collaboration in B2B: Measurable ROI Increase through LinkedIn Top Voices for a Scandinavian Industrial Conglomerate