The Starting Point: A Data Silo Problem
For a mid-sized B2B industrial distributor in the DACH region with 150 employees, the growth of their Amazon FBA business had outpaced their operational capabilities. The company managed a complex portfolio of industrial components, spanning thousands of SKUs across both Amazon FBA and direct B2B channels. The core issue was not a lack of demand, but a lack of visibility. Inventory tracking relied heavily on manual spreadsheet updates, creating a fragmented view of stock levels. This siloed approach led to a dual problem: frequent stockouts that alienated customers and damaged seller ratings, and excessive inventory accumulation that tied up critical working capital.
The financial impact was severe. The Total Advertising Cost of Sales (TACOS) had climbed to 18%. In a margin-sensitive industrial sector, this was unsustainable. Marketing teams were spending aggressively on ads for products that were often out of stock or had inaccurate listings, while other products sat stagnant in warehouses. The disconnect between marketing spend and inventory reality was eroding profitability from both sides: wasted ad spend and high storage fees. The leadership team recognized that without a systemic change, scaling the FBA channel was impossible. They needed a unified view of their operations that could react in real-time, not days later.
The Challenges
Before diving into the solution, it is crucial to understand the specific hurdles that made this project complex. We identified three primary challenges that required a tailored approach:
- Data Fragmentation: Inventory data lived in Amazon Seller Central, while lead and customer data resided in HubSpot. There was no single source of truth. Sales teams often quoted customers on stock availability that was outdated by 24-48 hours, leading to lost trust and manual correction overhead.
- Reactive Marketing Spend: The advertising strategy was decoupled from supply chain health. Ads ran continuously regardless of stock levels. When a key SKU hit zero inventory, the ad campaign continued to run for several days until a manual check caught the discrepancy, wasting budget on clicks that could not convert.
- Lack of Predictive Capability: The team had no mechanism to predict stockouts. Safety stock levels were static and did not account for seasonality, lead time variations from suppliers, or sudden spikes in demand. This resulted in a “whiplash” effect: either too much stock sitting idle or critical shortages during peak demand periods.
The Tech Stack
To address these challenges, we assembled a lean, integrated tech stack focused on real-time data flow and automation:
- Amazon Seller Central API: The primary source for real-time inventory levels, FBA inbound shipment status, and sales velocity data.
- HubSpot CRM: The central hub for customer data, lead scoring, and marketing automation. It served as the interface for the sales and marketing teams.
- Custom Middleware Layer: A lightweight Python-based service that handled data transformation, normalization, and API polling. It ensured that data from Amazon was cleaned and structured before being pushed to HubSpot.
- Looker Studio: Used for the real-time dashboard, providing a visual overview of inventory health, TACOS trends, and stockout risks to stakeholders.
Implementation: From Chaos to Control
The implementation was structured as an 8-week agile project, divided into four distinct phases. We prioritized data quality in the first two weeks, understanding that automation amplifies errors if the underlying data is dirty.
Phase 1: Data Centralization & Cleansing (Weeks 1-2) We began by extracting historical data from Amazon Seller Central and HubSpot. We identified duplicate SKUs, inconsistent naming conventions, and missing cost data. We built a mapping table that standardized all product identifiers. This step was critical; without it, the subsequent automation would have failed. We established a real-time data pipeline that polled Amazon’s API every 15 minutes for inventory updates and pushed these changes to a central data warehouse.
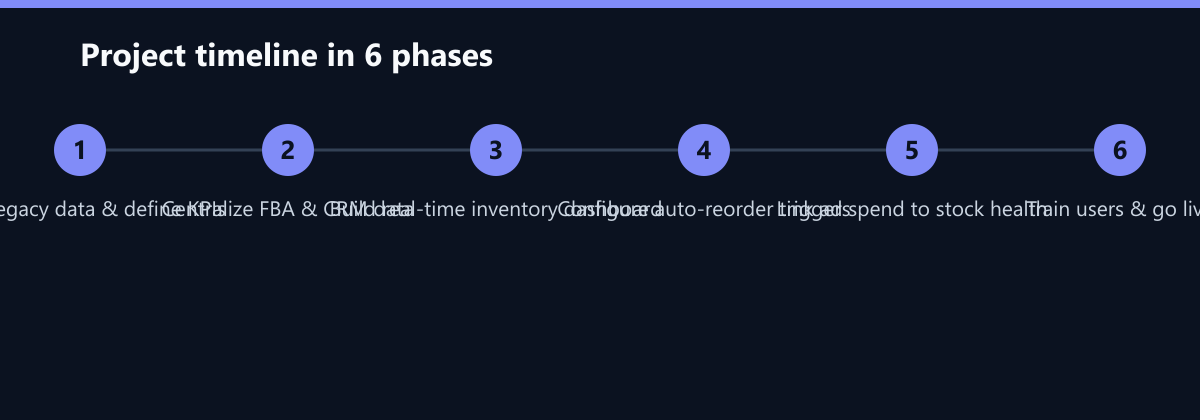
Phase 2: Building the Real-Time Dashboard (Weeks 3-4) With clean data flowing, we developed the unified dashboard. This tool connected FBA inventory levels directly with CRM lead data. For the first time, the sales team could see not just how many leads they had, but how much stock was available to fulfill those leads. The dashboard included a “Stock Health Score” for each SKU, calculated based on current inventory, incoming shipments, and historical sales velocity. This score was the key metric that would drive our automation rules.
Phase 3: Automated Reordering & Ad Alignment (Weeks 5-6) This was the core of the solution. We configured logic triggers within the middleware layer. When a SKU’s inventory dropped below its calculated safety stock level (dynamic, based on lead time and velocity), the system automatically generated a purchase order draft in the ERP system and notified the procurement team via Slack. More importantly, we linked the “Stock Health Score” to the marketing automation in HubSpot. If a SKU’s score dropped below a critical threshold, the system automatically paused the associated Amazon ad campaigns. This ensured that no ad spend was wasted on products that could not be delivered.
Phase 4: User Training & Go-Live (Weeks 7-8) We conducted workshops for the sales, marketing, and procurement teams. We trained them on how to interpret the new dashboard and how to override the automated rules in exceptional cases. We ran the system in “shadow mode” for one week, where it made recommendations but did not execute them, allowing the team to validate the logic against their manual processes. Once confidence was established, we switched to full automation.
How We Measured It
To ensure the results were credible, we established a clear measurement framework before launch. We defined the baseline metrics using the 90 days prior to implementation.
- TACOS Calculation: We tracked TACOS as a percentage of total revenue, comparing the ad spend to the revenue generated from those ads. We monitored this daily to catch any anomalies.
- Inventory Turnover: We calculated this as Cost of Goods Sold (COGS) divided by Average Inventory. This metric provided a clear view of how efficiently the company was moving its stock.
- Stock Accuracy: We defined this as the percentage of times the system’s reported inventory matched the physical count during random spot checks. We conducted these checks weekly to validate the API data integrity.
- Time Savings: We tracked the time spent by staff on manual inventory reconciliation and ad management using time-tracking software in HubSpot. We compared the pre-implementation baseline (estimated via employee surveys) with the post-implementation actuals.
Results: Measurable Impact
Within six months of full deployment, the automated system delivered significant improvements. The integration of supply chain data with marketing automation created a virtuous cycle of efficiency.
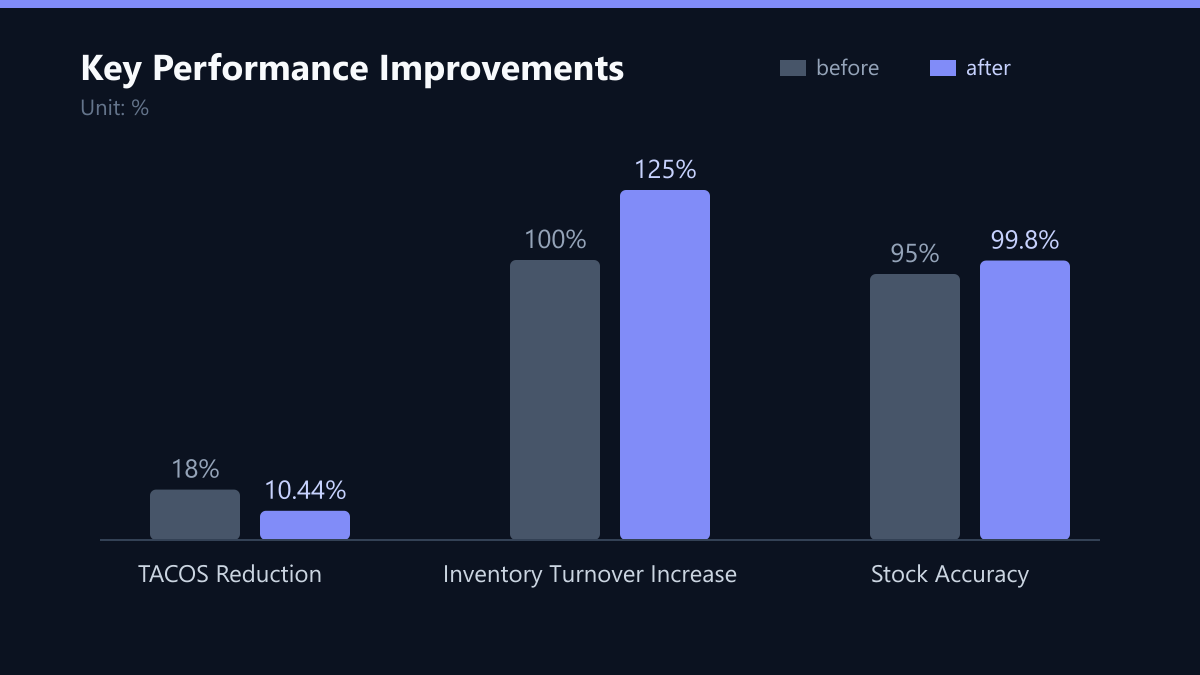
The most striking result was the reduction in TACOS. By pausing ads during stockouts and focusing spend on high-velocity, well-stocked items, the company reduced its TACOS from 18% to 10.44%, a reduction of 42%. This directly improved net margins. Inventory turnover increased by 25% as the automated reordering system prevented both stockouts and overstocking. The stock accuracy rate climbed to 99.8%, giving the sales team confidence in their commitments to customers. Perhaps most immediately felt by the team was the time savings. The 30 hours per week previously spent on manual spreadsheet updates and ad adjustments were reclaimed, allowing the team to focus on strategic growth initiatives.
Lessons Learned
This project highlighted several critical insights for any B2B company looking to automate their e-commerce operations.
First, data hygiene is non-negotiable. We spent nearly 25% of the project time on data cleansing. Attempting to automate a dirty dataset would have resulted in a system that made confident but incorrect decisions. It is better to invest time upfront in cleaning data than to spend months debugging incorrect triggers later.
Second, integration is more than just data flow. The success of this project hinged on the cultural shift within the company. The teams had to trust the system. We achieved this through the “shadow mode” phase and transparent communication about how the algorithms worked. If the team had not trusted the automated ad pausing, they would have manually re-enabled campaigns, negating the benefits.
Third, proactive management prevents revenue loss. The system’s ability to predict stockouts and pause ads saved not just money, but reputation. In B2B industrial distribution, trust is paramount. By ensuring that customers only saw products that were available, we maintained high satisfaction scores and reduced churn.
What We Would Do Differently Today
Despite the success, there are areas where we would refine the approach if starting over.
- Earlier ERP Integration: We initially focused on the Amazon and HubSpot integration. However, deeper integration with the ERP system for real-time cost updates would have allowed for more accurate margin calculations in the dashboard. We added this in a subsequent phase, but it would have been better included in the initial scope.
- More Granular Alerting: The initial alerting system was too broad. We would design a tiered alerting system from the start, distinguishing between critical stockouts (immediate action) and low stock (planning action), to reduce alert fatigue for the procurement team.
- Predictive AI for Demand: We used historical data for safety stock calculations. Integrating a simple predictive model that accounts for external factors (e.g., industry trends, economic indicators) could have further optimized inventory levels, though this may have added complexity that was not needed for the initial goal.
Conclusion
The transformation from manual chaos to automated control was not just a technical upgrade; it was an operational revolution for this DACH industrial distributor. By breaking down the silos between supply chain and marketing, they unlocked significant cost savings and efficiency gains. The 42% reduction in TACOS is a testament to the power of data-driven decision-making. For other B2B companies struggling with similar challenges, the lesson is clear: automation is not just about saving time; it is about creating a resilient, responsive business model that can scale with demand.
Passend dazu
- Performance Marketing
- SEO & AI Search (GEO)
- Automated Affiliate Workflows in HubSpot: From Click to Payout
- Affiliate Marketing
- Content & CRO
- Conversational Marketing
- From Amazon FBA to Own Brand: Raising TACOS to 320 Percent
- Automated Affiliate Attribution in HubSpot: Cutting CPA by 18% for a B2B SaaS Provider
- Automated Inventory-Driven Bidding for Nordic Furniture Brands
- From Amazon Abandonment to CRM Lead in 72 Hours
- Short-Form Video Strategy: From Idea to Automated CRM Sync in 7 Steps