The Hidden Cost of Poor Creative Quality
LinkedIn’s auction algorithm is not a simple highest-bidder-wins system. It is a complex engine that prioritizes engagement signals, relevance, and predicted click-through rates (CTR) alongside your bid amount. If your creative fails to stop the scroll, the platform charges a premium to secure visibility. This is why many B2B SaaS teams see their Cost Per Click (CPC) creep upward despite increasing budgets. The solution lies not in tweaking audience segments, but in rigorous creative optimization.
When you focus on creative iteration, you improve your Quality Score. A higher Quality Score signals to LinkedIn that your ad is valuable to users, which in turn lowers your effective CPC. This creates a compounding effect: as the algorithm learns which assets resonate with your Ideal Customer Profile (ICP), your costs decrease while your visibility increases. The core variables driving this are relevance (aligning message with intent), engagement (high CTR signals value), and efficiency (lower friction leads to lower costs over time).
Structuring Your Hypothesis for Data Integrity
A/B testing without a clear hypothesis is essentially budget waste. You must define one variable to change at a time. The primary metric for this guide is Cost Per Click (CPC), but you should track CTR and Conversion Rate as secondary indicators to ensure you are not sacrificing quality for quantity.
Use a strict hypothesis structure: If we change [Variable X], then [Metric Y] will improve by [Z%]. For example: If we use a pain-point question instead of a feature list, then CTR will increase by 15%. This clarity prevents scope creep and ensures that any results can be directly attributed to the specific change made.
Sample size is critical. For LinkedIn B2B audiences, you typically need 1,000+ impressions per variant to achieve statistical significance. Smaller samples lead to false positives and wasted spend. Do not make decisions based on 100 impressions; the data is too noisy to be reliable.
Headlines: The First Gatekeeper of Attention
Headlines are the first element users see. They determine whether the rest of the creative is viewed. Test emotional triggers against logical benefits to see which resonates better with your specific ICP.
Consider these three distinct approaches:
- Emotional: “Stop Losing Deals to Competitors” – appeals to fear and urgency.
- Logical: “Reduce Sales Cycle by 20% with AI Automation” – appeals to ROI and efficiency.
- Question: “Is Your CRM Actually Working for You?” – appeals to curiosity and self-reflection.
Keep your primary text under 125 characters for mobile visibility. Use line breaks to improve readability and bold key phrases sparingly to guide the eye. Avoid clickbait at all costs. It attracts low-intent clicks that inflate your CPC without generating qualified leads. The goal is to attract users who are ready to engage, not just users who are curious.
Visual Assets and Format Selection Strategy
Static images, carousels, and videos perform differently based on campaign objective. Carousels often yield higher CTR for educational content because they encourage interaction. Videos under 15 seconds perform best for retargeting, as they are short enough to be consumed quickly but long enough to convey a core message.
- Static Image: Best for brand awareness and simple CTAs.
- Carousel: Ideal for step-by-step guides or case studies.
- Video: Effective for complex product demonstrations.
Ensure visual consistency with your brand guidelines. High-contrast text on images improves accessibility and click-through rates. Test one visual style per campaign to isolate variables. Avoid cluttered designs that obscure the core message. If your visual is too busy, users will skip it, increasing your CPC due to lower engagement signals.
Aligning CTAs with Landing Page Experience
The Call-to-Action (CTA) must match the user’s expectation. A mismatch between the ad promise and the landing page experience increases bounce rates and, consequently, CPC. Use consistent language across the funnel to maintain user trust.
For example, if your ad CTA is “Download the Guide,” your landing page button should say “Get Your Free Guide Now.” Test different CTA verbs to see which drives the most action. “Start” implies action; “Learn” implies education; “Get” implies value. Align the CTA with the user’s stage in the buyer’s journey. Top-of-funnel users respond better to educational CTAs, while bottom-of-funnel users prefer direct action CTAs.
Implementation Protocol and Statistical Rigor
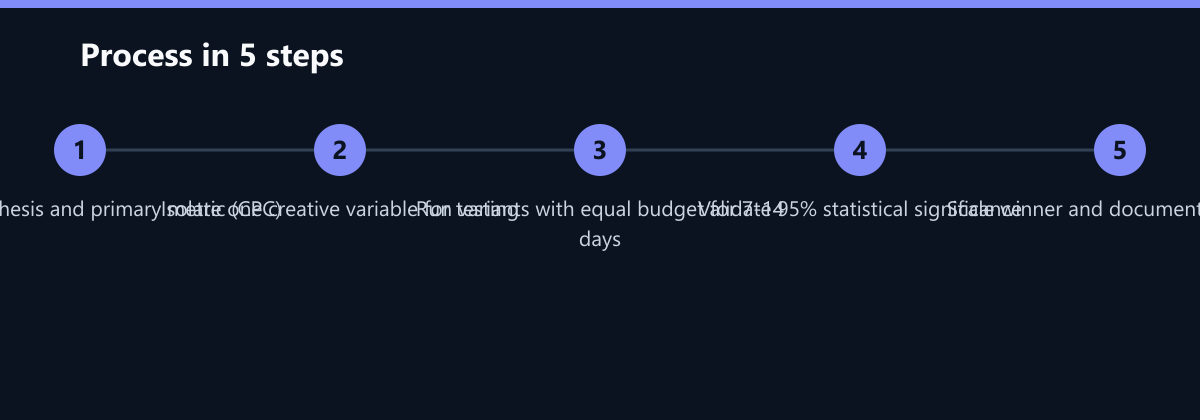
Follow a structured process to ensure reliable results. Do not stop tests early based on initial spikes. Wait for sufficient data accumulation to avoid acting on random variance.
- Launch: Run variants simultaneously with equal budget allocation.
- Monitor: Check daily for anomalies or technical issues that could skew data.
- Analyze: Use a significance calculator to determine confidence levels. Aim for 95% confidence before making decisions.
- Iterate: Scale the winning variant and test new hypotheses based on the results.
Document all tests in a central repository. This builds institutional knowledge and prevents your team from repeating failed experiments. It also provides a historical context for why certain creatives work, which is invaluable for long-term strategy.
Typical Mistakes That Invalidate Results
Many teams make errors that subtly or obviously invalidate their test results. Avoid these common pitfalls to maintain data integrity:
- Testing Multiple Variables: Changing the headline and the image simultaneously makes it impossible to know which change drove the result. Isolate one variable at a time.
- Ignoring Seasonality: Comparing Q4 results with Q1 data is flawed due to different buying behaviors and market conditions. Ensure your test periods are comparable.
- Frequency Capping Neglect: Allowing ads to show too often causes fatigue, which lowers engagement and increases CPC. Monitor frequency caps and refresh creatives when needed.
- Small Sample Sizes: Making decisions based on 100 impressions is statistical noise. Always wait for the required sample size.
How You Measure Success
To determine if your creative optimization is working, track these specific KPIs:
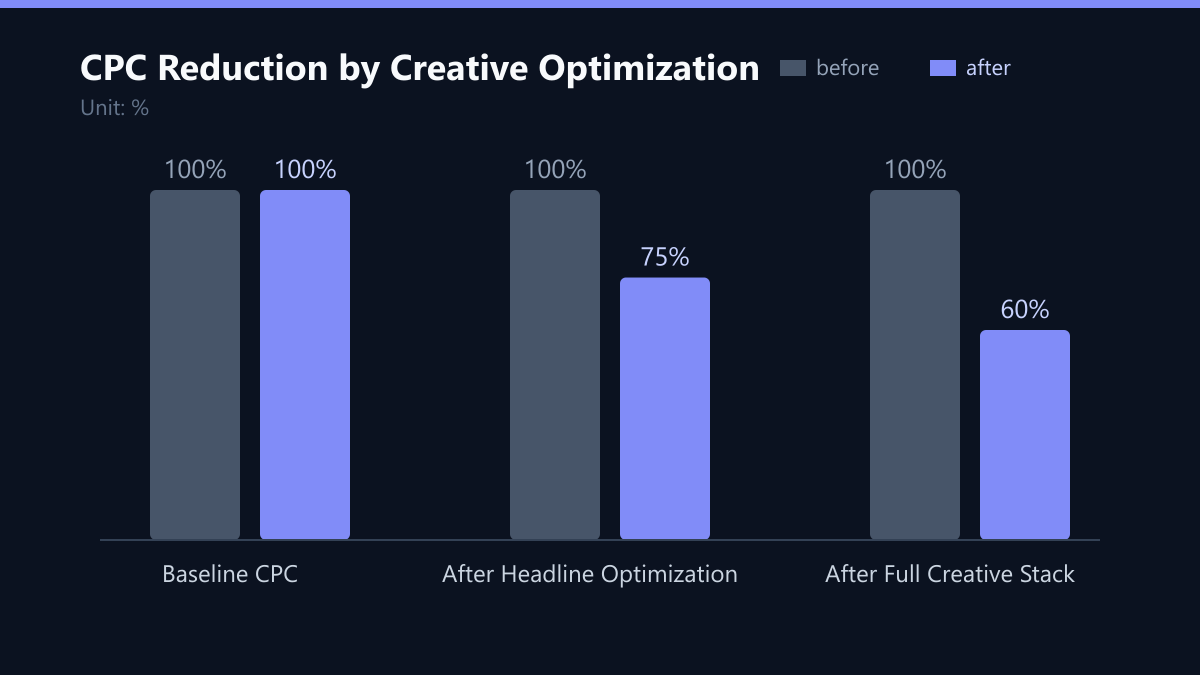
- CPC Reduction: The primary target. A successful test should show a 10-40% reduction in CPC.
- CTR Improvement: A secondary indicator. Higher CTR usually correlates with lower CPC.
- Cost Per Lead (CPL): The ultimate business metric. Ensure that lower CPC translates to lower CPL, not just more low-quality clicks.
- Statistical Confidence: Always report the confidence level (e.g., 95%) alongside your results to validate the significance of the findings.
Use a dashboard to track these metrics in real-time. Compare the performance of the winning variant against the control group to quantify the exact impact of your changes.
Checklist for Your Next A/B Test
- Define a single, clear hypothesis.
- Ensure you have a budget of at least $500 per variant.
- Isolate one creative variable (headline, image, or CTA).
- Run the test for 7-14 days to capture weekly patterns.
- Wait for 95% statistical significance before making decisions.
- Document the results and scale the winning variant.
By following this structured approach, you can systematically lower your CPC and improve the overall efficiency of your LinkedIn campaigns. Continuous optimization is key to sustained success in the ever-changing digital landscape.
Passend dazu
- Performance Marketing
- SEO & AI Search (GEO)
- LinkedIn Campaign Optimization: Reducing CPL by 28% for a Scandinavian FinTech Provider through Server-Side Tracking and A/B Testing
- ROI Optimization for a Benelux Logistics Service Provider through A/B Testing of Video Creatives on Meta and LinkedIn
- Affiliate Marketing
- Content & CRO
- CRM Marketing
- A/B Testing Email Layouts: Data-Driven Optimization for Higher Click-Through Rates
- Ad Copy Testing: 5 A/B Test Methods to Boost CTR
- Dynamic Creative Optimization for B2B SaaS: Boosting CTRs
- HubSpot A/B Testing Guide: 5 Steps to Significant Conversion Growth
- CRO Testing Plan: From Hypothesis to Implementation in 14 Days
- Localized Campaigns for Italian Industrial Manufacturer: 18% More Conversions
- How to Fix Negative ACOS: A 5-Step Audit for Underperforming Amazon Campaigns