The Strategic Value of Layout Testing
Email layout determines how quickly a reader identifies value and takes action. In B2B environments, attention spans are short, and visual hierarchy dictates engagement. Structured A/B testing moves optimization from guesswork to evidence-based strategy.
Most teams focus on subject lines but neglect the body structure. This is a critical oversight. The layout influences readability, trust, and the path to conversion. By testing structural elements, you reduce friction and increase the likelihood of a click.
- Improved Readability: Clear sections reduce cognitive load.
- Higher Engagement: Visual cues guide the eye to primary CTAs.
- Scalable Insights: Data from tests informs future campaign design.
Focus on structural changes rather than cosmetic tweaks. This ensures that results reflect user behavior, not just aesthetic preferences.
Defining Testable Hypotheses
Effective testing starts with a clear hypothesis. Vague goals like ‘make it look better’ yield useless data. Define what you are changing and why you expect it to perform better.
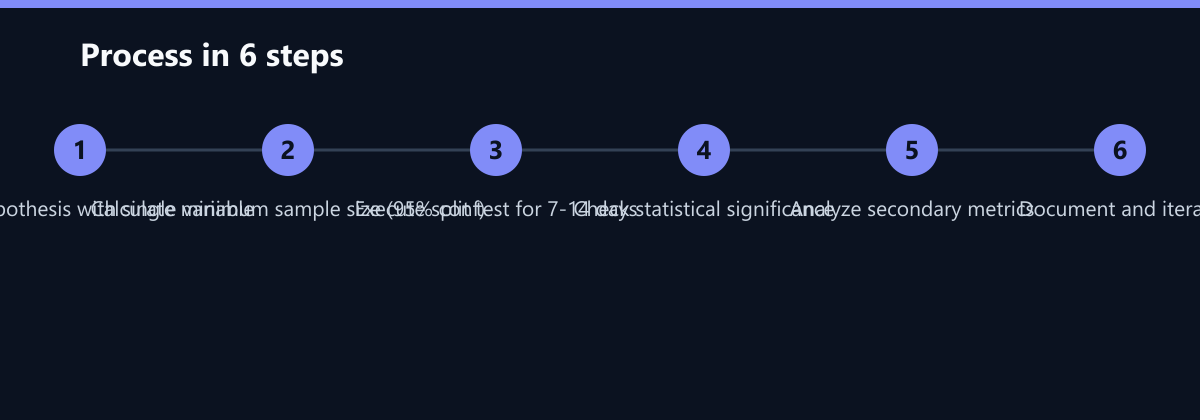
A strong hypothesis follows the format: If we change X, then Y will happen because Z. This structure forces logical reasoning and aligns the test with business objectives.
- Single Variable Rule: Test only one element at a time.
- Measurable Outcome: Link the change to a specific KPI.
- Business Context: Connect the test to revenue or pipeline goals.
Example: If we move the primary CTA above the fold, then CTR will increase because users will see the call to action without scrolling. This approach eliminates ambiguity in result analysis.
Key Layout Elements to Test
Not all layout components carry equal weight. Prioritize elements that directly impact user decision-making. Start with high-impact areas before moving to minor details.
Call-to-Action (CTA) Placement The position of your button determines visibility. Test top, middle, and bottom placements. In B2B emails, a single, prominent CTA often outperforms multiple options.
Visual Hierarchy and White Space Cluttered designs reduce readability. Test different spacing densities. Generous white space often improves focus on key messages.
- Header Images: Test with and without hero images.
- Text Density: Compare paragraph lengths and bullet points.
- Button Style: Test color, size, and shape variations.
Responsive Design Ensure layouts adapt seamlessly to mobile devices. Test how images and text reflow on smaller screens. Mobile-first design is non-negotiable in modern B2B communication.
Statistical Significance and Sample Size
A/B testing is a statistical process, not a snapshot. Drawing conclusions from small samples leads to false positives. You need sufficient data to trust the results.
Minimum Sample Size Calculate the required sample size based on your expected conversion rate and desired confidence level. A common benchmark is 95% confidence with a 5% margin of error. Most B2B email campaigns require at least 1,000 sends per variant to achieve statistical power.
Duration and Timing Run tests for a full business cycle. Weekly patterns affect open and click rates. Ensure both variants run for the same duration to avoid bias from day-of-week effects.
- Avoid Early Stopping: Do not stop a test just because one variant leads early.
- Check for Anomalies: Exclude data from technical errors or send failures.
- Use Calculators: Leverage online sample size tools for accuracy.
Ignoring statistical significance is the most common mistake in email testing. It leads to inconsistent performance and wasted resources.
Analyzing Results and Iterating
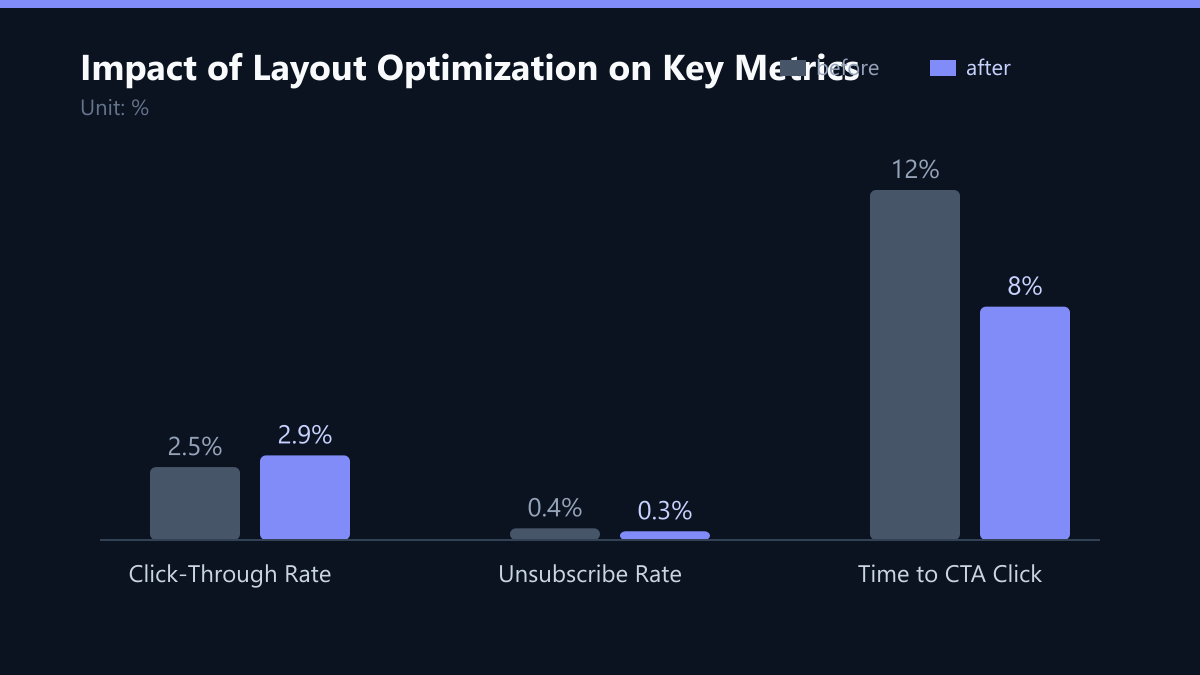
Data analysis is where insights become action. Look beyond the primary metric to understand the full picture. A higher CTR might come at the cost of increased unsubscribes. Always review secondary metrics.
Primary Metrics
- Click-Through Rate (CTR)
- Conversion Rate
Secondary Metrics
- Open Rate (with caution, due to inbox rendering issues)
- Bounce Rate
- Unsubscribe Rate
If Variant B shows a 10% lift in CTR but a 5% increase in unsubscribes, the net value may be negative. Calculate the total impact on revenue or pipeline. Document every test, regardless of outcome. Failed tests provide valuable negative space knowledge. They tell you what not to do.
Create a centralized repository for test results. This builds institutional knowledge and prevents repeating ineffective strategies. Regular review cycles ensure continuous improvement.
Implementation Best Practices for B2B SaaS
B2B SaaS audiences have specific expectations. They value clarity, relevance, and efficiency. Your email layouts must reflect this professional context.
Segmentation Matters Test layouts across different segments. New leads may respond differently to existing customers. Tailor your testing strategy to your audience lifecycle stage.
- Onboarding: Focus on education and quick wins.
- Nurture: Emphasize value propositions and social proof.
- Retention: Highlight new features and benefits.
Tool Integration Use your CRM and marketing automation platform to automate test execution. This ensures consistency and reduces manual errors. Integrate testing with lead scoring to prioritize high-value prospects.
Consistency Across Channels Align email layouts with your website and other touchpoints. Inconsistent design erodes trust. Ensure brand guidelines are followed while testing structural variations.
Start small, measure rigorously, and scale what works. This disciplined approach drives sustainable growth in competitive B2B markets.
Typical Mistakes
Even experienced marketers fall into these traps. Avoiding them saves time and protects your list health.
- Testing Multiple Variables Simultaneously: Changing the subject line, CTA color, and image in one test makes it impossible to attribute success or failure. Stick to the single-variable rule.
- Stopping Tests Too Early: Seeing a lead after 500 opens and stopping the test introduces high variance. Always wait for the pre-calculated sample size to be reached to ensure statistical validity.
- Ignoring Secondary Metrics: Focusing solely on CTR can hide negative impacts on unsubscribes or bounce rates. A higher CTR that drives more unsubscribes is a net loss for long-term list health.
How You Measure Success
Success is not just a higher click rate; it is a positive impact on business goals. Use these KPIs to validate your tests:
- Net Revenue Impact: Calculate (CTR Lift × Average Order Value) minus (Unsubscribe Increase × Customer Lifetime Value). This gives a true financial picture.
- Statistical Confidence: Ensure your p-value is below 0.05. If it is not, the result is likely due to chance, not design.
- Time to Decision: Measure how long users spend in the email before clicking. A well-optimized layout should reduce this time by 15-20%, indicating clearer value proposition.
Use your marketing automation platform’s native reporting tools for primary data. Supplement with heatmaps if available to see where users are actually looking versus where they are clicking.
Checklist
Before launching your next A/B test, verify these points:
- Hypothesis is written in “If X, then Y because Z” format.
- Only one variable is being changed between Variant A and B.
- Sample size calculator confirms required sends per variant.
- Test duration covers at least one full business cycle (7-14 days).
- Mobile preview has been checked for both variants.
- Secondary metrics (unsubscribes, bounces) are being tracked.