The Hidden Cost of Fragmented RevOps in DACH
In the DACH mid-market, the disconnect between marketing and sales is often treated as a cultural hurdle, but it is primarily a structural data failure. Many B2B SaaS companies operate in silos: marketing generates leads in one tool, sales manages pipelines in another, and customer success tracks retention in a third. This fragmentation creates a ‘data black hole’ where critical signals are lost, and technology investments yield diminishing returns.
A structured RevOps (Revenue Operations) maturity analysis is not just a technical audit; it is a strategic necessity. It moves the conversation from “we need better tools” to “we need better data flow.” By establishing a baseline against five precise KPIs, you can identify exactly where value is leaking from your revenue engine. The following guide provides the objective framework to evaluate your current status and plan a scalable path to efficiency.
KPI 1: Data Integrity as the Foundation
Before automation can work, data must be clean. In the DACH region, CRM hygiene is frequently the weakest link. Customer information is often scattered across email clients, spreadsheets, and sales apps, leading to fragmented records. If your data is inconsistent, your automation is merely amplifying errors.
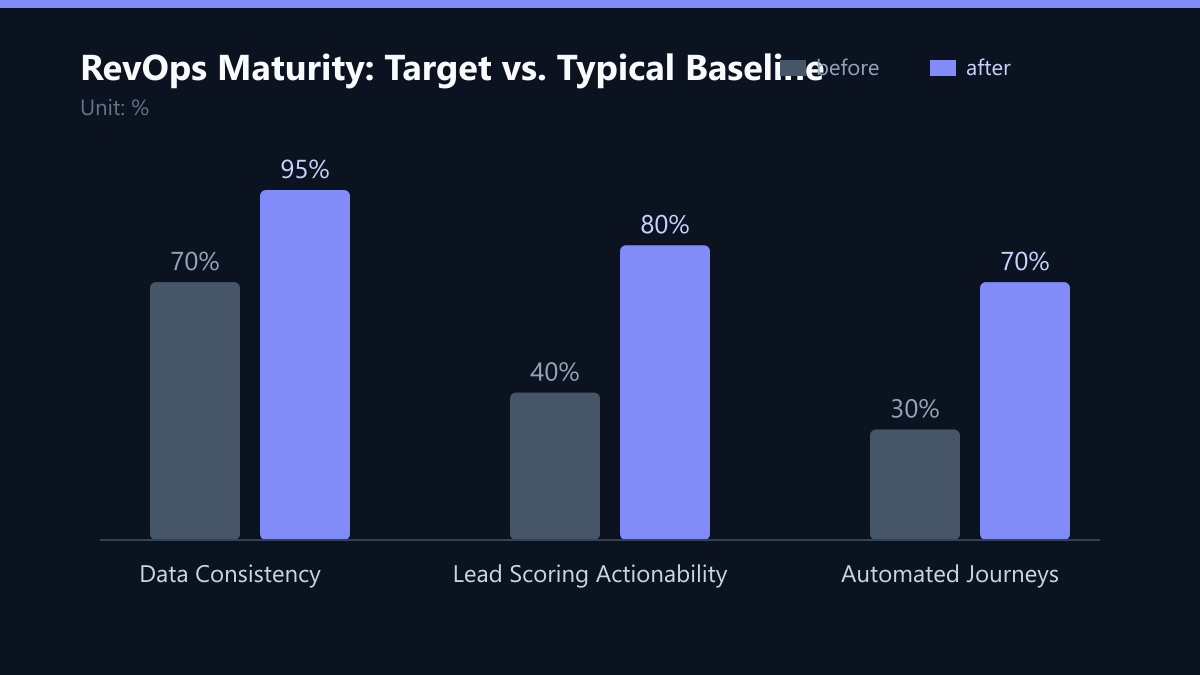
Target Value: At least 95% of active contacts must have unique, verified IDs in the CRM.
To measure this, you must look beyond simple record counts. Check the duplication rate in your CRM using native deduplication tools or external scripts. Measure the frequency of manual entries by sales reps—high manual input is a direct signal of low maturity. Finally, evaluate whether marketing events (like webinar registrations or content downloads) are automatically enriched in the CRM without human intervention. If a sales rep has to copy-paste a lead’s details from a marketing platform to the CRM, your maturity level is low. Automated synchronization is the first non-negotiable step toward a mature RevOps stack.
KPI 2: The 5-Minute Rule for Lead Response
Speed is the most decisive competitive advantage in B2B SaaS. The window between lead generation and the first qualitative interaction is where deals are won or lost. In the DACH market, where relationship-building is critical, initial speed signals professionalism and urgency.
Target Value: First contact within 5 minutes for digital leads.
Data consistently shows that a response time of more than 30 minutes reduces the conversion chance by up to 76%. To audit this, analyze the average time to first contact across all channels. Compare the response times of marketing-qualified leads (MQLs) versus sales-qualified leads (SQLs) to identify if the handoff is the bottleneck. Identify specific bottlenecks in your lead routing logic. Are leads sitting in a queue because no sales rep is available? Are routing rules based on static territories rather than dynamic capacity? Automated routing rules that distribute leads based on rep availability and specialization are essential to hit this 5-minute target.
KPI 3: Lead Scoring That Drives Action
Not all leads are equal, but in many DACH mid-market companies, lead scoring is used only in a piecemeal way. Scores exist, but they do not drive behavior. If sales ignores the score, the model is not practical.
Target Value: 80% of leads marked as “hot” are contacted by sales within 48 hours.
To measure the accuracy and actionability of your scoring, evaluate the correlation between the score and actual conversion. A high score that does not convert indicates a model that needs recalibration. Check whether sales teams actively use the scores in their pipeline prioritization. If reps are calling leads in the order they received them, rather than the order of highest value, the scoring system is failing. Analyze the rejection rate by sales. If sales rejects a high percentage of “hot” leads, it signals a misalignment between marketing’s definition of ready and sales’ definition of ready. Regular calibration sessions between marketing and sales are required to keep the model relevant.
KPI 4: CAC Payback and Economic Efficiency
The economics of acquisition must be clearly measurable. In the DACH region, marketing budgets are often rigid, making flexible adjustments difficult. The Customer Acquisition Cost (CAC) payback period shows how quickly a lead recovers the cost invested in it. This metric is crucial for determining if you can scale profitably.
Target Value: CAC payback under 12 months for standard B2B SaaS contracts.
To calculate this, determine the total cost per won customer, including marketing and sales expenses. Compare the payback time per sales channel to identify which sources are inefficient. Analyze the customer lifetime value (CLV) in relation to the CAC. A CLV:CAC ratio of at least 3:1 is the standard for healthy scaling. If your ratio is lower, you are overpaying for customers or not retaining them long enough. Deviations from the 12-month payback standard point to inefficient channels or pricing issues that need immediate attention.
KPI 5: Automation Level of Customer Journeys
Manual processes tie up valuable resources and limit scalability. The degree of automation in email and in-app journeys measures your technical maturity. In the mid-market, simple email campaigns without dynamic logic often dominate, leading to generic communication that fails to engage.
Target Value: 70% of customer interactions run through automated, behavior-based journeys.
Count the number of active, rule-based journeys in your marketing automation platform. Measure the engagement rate in automated versus manual campaigns. Typically, automated journeys show higher open and click-through rates because they are triggered by specific user behavior. Check the integration of product data into the communication. Static lists lead to irrelevant communication. Dynamic journeys based on product usage, feature adoption, or support tickets significantly increase retention and expansion revenue.
Implementation: From Audit to Action
Measuring these KPIs is only the first step. The value lies in the consistent implementation of the insights. A structured approach prevents data from remaining without actionability.
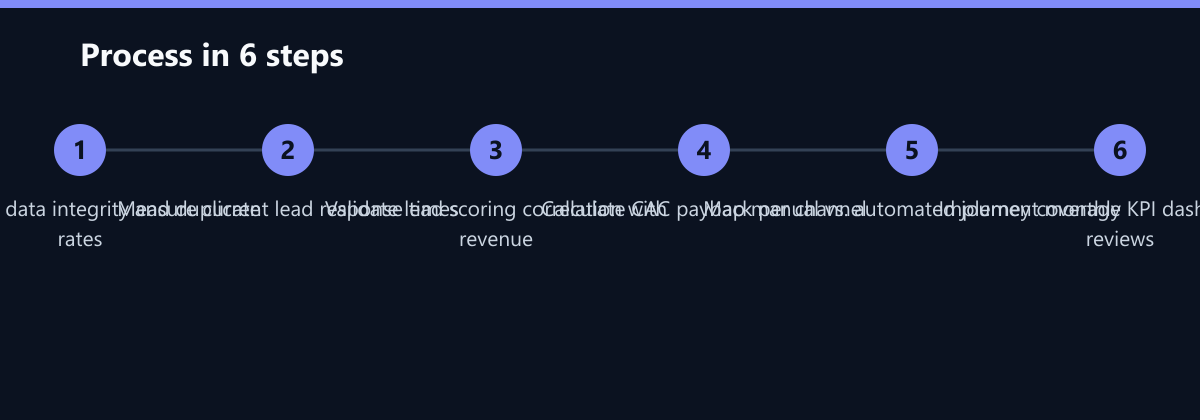
- Create a Monthly RevOps Report: Consolidate the five KPIs into a single dashboard accessible to both marketing and sales leadership.
- Define Clear Responsibilities: Assign a specific owner for each metric. For example, Marketing owns Data Integrity and Lead Scoring, while Sales owns Response Time and CAC Payback.
- Set Quarterly Review Targets: Focus on the KPI with the largest deviation from the target value. Small, consistent improvements lead to measurable results. Regular reviews secure continuous optimization and prevent regression.
Typical Mistakes to Avoid
- Over-Engineering the Scoring Model: Many teams spend months building complex AI-based scoring models before establishing basic data hygiene. Start with simple rule-based scoring and clean data before adding complexity.
- Ignoring the Sales Handoff: Focusing solely on marketing automation without aligning with sales workflows. If sales does not trust the lead data, the automation is useless. Involve sales in the calibration of scoring models from day one.
- Setting Static Targets: Using the same KPI targets for all channels or customer segments. A 5-minute response time may be unrealistic for enterprise leads but essential for SMB leads. Segment your targets accordingly.
How You Measure Success
To ensure your RevOps maturity analysis leads to tangible results, track the following concrete KPIs and methods:
- Data Quality Score: Method: Run a monthly deduplication script and count verified unique IDs. Target: 95%+.
- Average Response Time: Method: Timestamp analysis from lead creation to first logged call/email. Target: <5 minutes.
- Lead-to-Opportunity Conversion: Method: Compare conversion rates of scored vs. unscored leads. Target: 20% higher for scored leads.
- CAC Payback Period: Method: Financial analysis of marketing/sales spend vs. first-year revenue per customer. Target: <12 months.
- Journey Engagement Rate: Method: Compare CTR of automated behavior-based emails vs. static blasts. Target: 30% higher for automated.
Checklist for Your First RevOps Audit
- Export CRM Data: Pull a sample of 1,000 recent contacts to check for duplicates and missing fields.
- Map the Lead Flow: Document every step a lead takes from form fill to first sales call. Identify manual handoffs.
- Review Scoring Logic: List the current scoring criteria. Interview three sales reps to ask if they trust the scores.
- Calculate Channel CAC: Break down marketing spend by channel and match it to won deals. Calculate payback per channel.
- Audit Journey Coverage: List all customer touchpoints. Mark which are automated and which are manual. Calculate the percentage of automated interactions.
By following this structured approach, you transform your RevOps function from a cost center into a strategic driver of growth. The DACH mid-market rewards precision and efficiency. Use these five KPIs to build a revenue engine that is not just faster, but fundamentally more effective.
Passend dazu
- Performance Marketing
- Affiliate Program with 40% Discount Reduces CAC by 28% in the DACH Region
- B2B Industry: 34% Reduction in CPA through Dynamic Google Ads Campaigns and HubSpot Attribution in the DACH Region
- RevOps & Reporting
- Affiliate Marketing
- Content & CRO
- Google Ads vs. Bing Ads: Cost-Benefit Analysis for B2B in the DACH Region
- Form Optimization: The 7 Fields That Really Scare Off B2B Leads in the DACH Region
- Google Ads vs. HubSpot Ads: Cost-Benefit Analysis for B2B Mid-Market
- LinkedIn Groups vs. Facebook Groups: Building a B2B Community in the DACH Region
- RevOps vs. SalesOps: Key Differences and Implementation for B2B Mid-Market
- Performance Marketing in B2B Fintech: Compliance and Tracking in the DACH Region
- Benchmarks for B2B Marketing Efficiency: What Good RevOps Metrics Look Like
- Video Production Capacity Planning: Inhouse vs. Agency Model in DACH