The Foundation of Unified Revenue Operations
Revenue Operations (RevOps) is no longer just a buzzword; it is the structural backbone of high-growth B2B SaaS companies. The core problem it solves is the disconnect between marketing, sales, and customer success. When these teams operate in silos, data becomes fragmented, and the true cost of acquiring a customer is obscured. A robust RevOps framework unifies these functions into a single source of truth, ensuring that every dollar spent on acquisition contributes directly to sustainable revenue.
The foundation of this model rests on three critical pillars. First, a Unified Data Layer must integrate your CRM, marketing automation, and billing systems. Without this, you are flying blind. Second, teams must agree on Shared KPIs, such as Net Revenue Retention (NRR), rather than optimizing for conflicting goals like lead volume versus deal size. Third, Attribution Modeling must evolve from simplistic last-click models to multi-touch approaches that reflect the complex B2B buying journey. This alignment eliminates internal friction and allows for precise measurement of marketing efficiency.
Acquisition Cost Benchmarks and Payback Periods
Customer Acquisition Cost (CAC) is the most critical efficiency metric for growth-stage SaaS firms. It represents the total sales and marketing spend required to acquire one new customer. A high CAC is not inherently bad if the Customer Lifetime Value (LTV) is sufficiently high, but the ratio must remain sustainable. Understanding where you stand relative to industry peers is the first step in optimizing this metric.
Typical B2B SaaS CAC Benchmarks by Company Size:
- Startups (ARR < $5M): $10,000 – $25,000. High variance is common due to early-stage experimentation.
- Growth Stage ($5M – $50M ARR): $25,000 – $60,000. Efficiency improves as scalable channels are identified.
- Enterprise Scale ($50M+ ARR): $60,000 – $150,000+. High-touch sales motions dominate this segment.
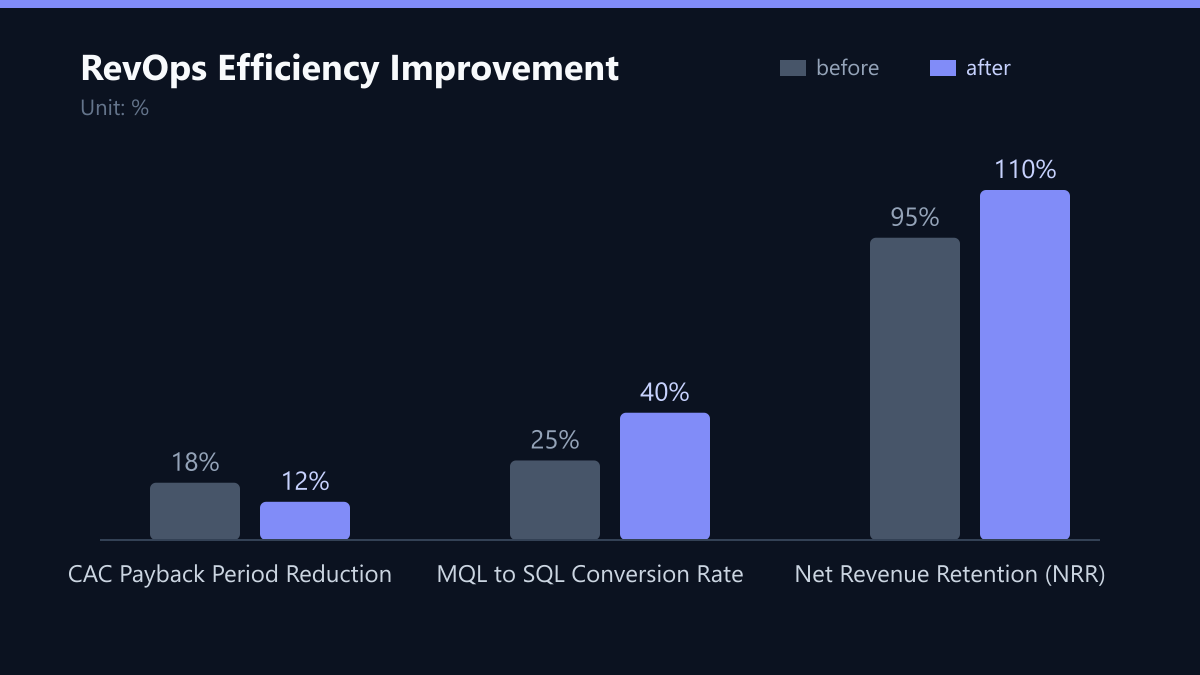
To keep CAC in check, you must monitor the Payback Period. Ideally, this should be under 12 months for venture-backed companies. If it exceeds 18 months, cash flow risks emerge, and your growth model may be unsustainable. Focus on reducing costs per lead (CPL) without sacrificing lead quality. Key levers to optimize CAC include improving lead scoring accuracy to prioritize high-intent prospects, automating initial qualification to reduce sales team overhead, and shifting budget from broad-brand awareness to intent-based demand generation.
Accelerating Pipeline Velocity and Conversion
Efficiency is not just about spending less; it is about converting faster. Pipeline velocity measures how quickly a deal moves from first contact to closed-won. Slow velocity ties up capital and increases the risk of deal slippage. Top performers in B2B SaaS aim for a sales cycle length of 60 to 90 days for mid-market deals. If your cycle is significantly longer, you are likely losing deals to competitors with more agile processes.
Average Conversion Rates by Stage:
- Visitor to Lead: 2% – 5% (Depends heavily on content quality and traffic source).
- Lead to MQL (Marketing Qualified Lead): 15% – 30%.
- MQL to SQL (Sales Qualified Lead): 30% – 50%.
- SQL to Opportunity: 40% – 60%.
- Opportunity to Closed Won: 20% – 40%.
If your MQL-to-SQL conversion rate drops below 25%, your lead definition is likely misaligned with sales expectations. RevOps teams must regularly review disqualification reasons to refine targeting criteria. To accelerate pipeline velocity, implement automated nurture sequences for leads not ready to buy, use intent data to trigger immediate sales outreach, and standardize handoff processes between marketing and sales to eliminate lag time.
Implementing Your RevOps Framework
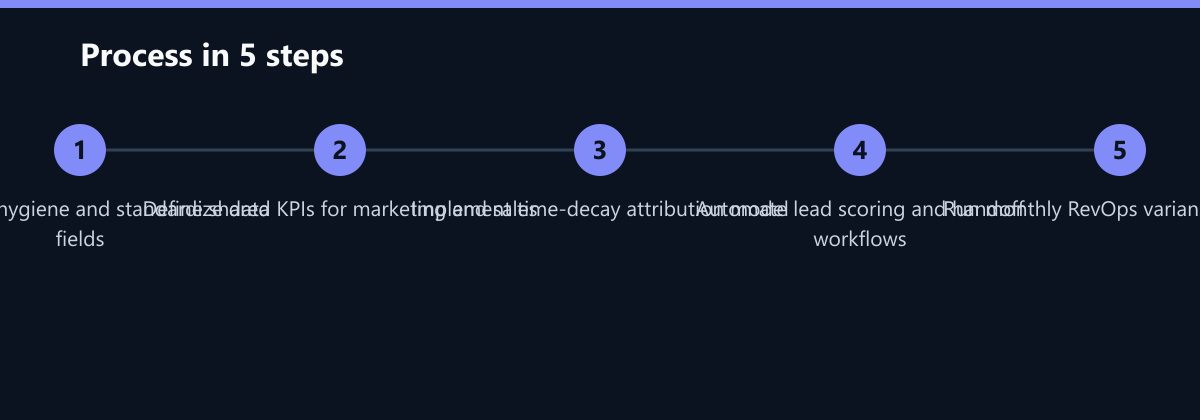
Building a RevOps culture is a step-by-step process that requires discipline and technical precision. Here is how to implement the framework effectively:
- Conduct a Data Audit: Ensure your CRM hygiene is impeccable. Inconsistent data leads to inaccurate benchmarks. Standardize field definitions and eliminate duplicates.
- Define Core KPIs: Agree on clear formulas and owners for metrics like CAC, LTV, and NRR. Ensure marketing and sales use the same definitions.
- Establish Baselines: Record your current quarter’s metrics to create a baseline for comparison.
- Set Quarterly Targets: Use industry benchmarks and internal trends to set realistic but ambitious goals.
- Automate Dashboards: Build real-time visibility into performance using BI tools.
- Run Variance Analysis: Conduct monthly reviews to identify root causes of underperformance.
LTV:CAC Ratio and Retention Metrics
The ratio of Customer Lifetime Value (LTV) to Customer Acquisition Cost (CAC) is the ultimate indicator of unit economics. A healthy SaaS business targets a ratio of at least 3:1. This means you earn three dollars in lifetime revenue for every dollar spent on acquisition. Ratios below 2:1 indicate unsustainable growth, while ratios above 5:1 may suggest under-investment in growth.
Critical Retention Indicators:
- Net Revenue Retention (NRR): Aim for 100% – 120%. This metric captures expansion revenue from existing customers.
- Gross Retention: Aim for 90% – 95%. This measures revenue loss from churn only.
- Logo Churn: Keep under 5% annually for mid-market SaaS.
High NRR reduces the effective CAC because you are growing revenue from existing relationships. RevOps teams should segment LTV by customer cohort to identify which acquisition channels drive the most profitable long-term customers. Focus on increasing Average Revenue Per User (ARPU) through upsell campaigns and reducing churn by identifying at-risk accounts early using usage data.
Measuring Marketing Contribution to Revenue
Marketing teams are often judged on volume rather than value. To prove efficiency, you must link marketing activities directly to revenue outcomes. This requires a robust attribution model that accounts for multiple touchpoints. While last-click attribution is simple, it undervalues top-of-funnel activities like content marketing and thought leadership.
Attribution Models for B2B SaaS:
- First-Touch: Credits the initial interaction. Useful for evaluating brand awareness campaigns.
- Linear: Distributes credit equally across all touchpoints. Good for long sales cycles.
- Time-Decay: Gives more credit to interactions closer to conversion. Balances awareness and decision phases.
- Multi-Touch: Uses data science to weight touchpoints based on impact. Most accurate but requires high data maturity.
For most mid-market B2B companies, a time-decay model provides the best balance between accuracy and implementation complexity. Track Marketing-Influenced Revenue rather than just Marketing-Attributed Revenue. This includes all deals where marketing touched the account, even if the final click came from a direct visit.
How You Measure Success
To ensure your RevOps implementation is working, you need concrete KPIs and methods for measurement. Do not rely on gut feeling; use data to validate your strategy.
- CAC Payback Period: Measure this by dividing total CAC by the monthly gross margin per customer. Target: < 12 months. Method: Use billing data to calculate monthly gross margin and CRM data for CAC.
- MQL to SQL Conversion Rate: Track the percentage of MQLs that are accepted by sales. Target: > 30%. Method: Review CRM stage transitions monthly. If below target, conduct joint marketing-sales reviews to refine lead definitions.
- Net Revenue Retention (NRR): Calculate as (Starting ARR + Expansion - Churn - Downgrade) / Starting ARR. Target: > 100%. Method: Segment by cohort to identify which customer groups drive expansion. Use this data to adjust onboarding and success strategies.
- Pipeline Velocity: Measure the average number of days from opportunity creation to closed-won. Target: 60-90 days for mid-market. Method: Analyze CRM timestamps. Identify stages with the longest dwell time and implement targeted interventions.
Typical Mistakes to Avoid
Even experienced teams make critical errors when implementing RevOps. Avoid these common pitfalls:
- Ignoring Data Hygiene: Building complex dashboards on top of dirty CRM data leads to inaccurate insights. Always prioritize data cleaning before advanced analytics.
- Misaligned Lead Definitions: If marketing defines an MQL differently than sales, the MQL-to-SQL conversion rate will suffer. Hold regular alignment meetings to ensure both teams agree on what constitutes a qualified lead.
- Over-Reliance on Last-Click Attribution: This model undervalues top-of-funnel activities, leading to underinvestment in content and brand building. Use time-decay or multi-touch models for a more accurate view of channel performance.
- Static Benchmarks: Treating industry benchmarks as fixed targets rather than directional guides. Your business is dynamic, and your targets should evolve as you scale.
Checklist for RevOps Implementation
Use this checklist to ensure you have covered all critical aspects of your RevOps setup:
- CRM, marketing automation, and billing systems are integrated.
- Core KPIs (CAC, LTV, NRR) are defined with clear formulas.
- Lead definitions (MQL, SQL) are aligned between marketing and sales.
- Attribution model (time-decay recommended) is implemented.
- Automated dashboards are live for real-time visibility.
- Monthly RevOps review cycle is scheduled with all stakeholders.
- Data hygiene audit is completed and ongoing processes are in place.
- Quarterly targets are set based on benchmarks and internal trends.
By treating marketing efficiency as a continuous improvement process, you build a resilient revenue engine that scales predictably. Focus on the metrics that drive sustainable growth, not just short-term wins. This approach ensures that your marketing efforts are not just visible, but valuable to the bottom line.