The Hidden Cost of Marketplace Silos
Most marketing teams rely exclusively on Amazon’s internal reporting to evaluate ad performance. This approach calculates Return on Ad Spend (ROAS) based solely on direct conversions within the marketplace. While convenient, this metric creates a significant blind spot. It ignores post-purchase behavior, repeat orders, and the cross-channel influence that drives long-term value. For B2B SaaS companies and mid-market brands with complex sales cycles, this leads to a dangerous underinvestment in high-potential keywords.
True ROAS shifts the perspective. It measures the total lifetime value (LTV) of customers acquired through Amazon ads. To calculate this, you must connect marketplace data with your Customer Relationship Management (CRM) system. This integration reveals the full revenue picture, moving the focus from single transactions to sustained customer relationships. Without this link, you are essentially optimizing for the first sale while ignoring the profit that follows.
- Direct ROAS: Revenue from the specific ad click within a 7- or 14-day window. This is the standard Amazon metric.
- True ROAS: Total revenue generated by the customer over their lifetime, attributed to the initial ad touchpoint. This requires external data validation.
Why Standard Metrics Mislead B2B Teams
Amazon’s default metrics assume a simple, linear purchase journey. A user clicks an ad, buys the product, and the transaction is recorded. B2B SaaS sales cycles, however, are rarely this straightforward. They are longer, involve multiple stakeholders, and often require significant nurturing. A single click on an Amazon ad rarely closes a deal immediately. The prospect may download a whitepaper, schedule a demo, negotiate terms, and sign a contract weeks or even months later.
Relying on short-term attribution windows causes two major strategic issues:
- Underestimating Value: High-intent keywords appear unprofitable because the revenue is recorded later in the CRM, outside the Amazon attribution window.
- Misallocated Budget: Teams cut spend on effective channels that drive long-term value, shifting budget to low-quality, quick-convert campaigns that offer little long-term growth.
To fix this, you must map Amazon customer identifiers to your CRM records. This creates a unified view of customer acquisition costs (CAC) and revenue, allowing for accurate budget allocation.
Step 1: Unifying Customer Data
The first step is creating a unique identifier that links Amazon data to your CRM. Amazon does not share customer names or emails directly due to privacy regulations. You must use a proxy identifier to bridge this gap securely.
Common identifiers include:
- Amazon Customer ID: A unique hash provided by Amazon Marketing Cloud (AMC).
- Email Hash: If you capture emails at purchase or via post-purchase inserts, hash them using SHA-256 to match with CRM data.
- Order ID: Use the Amazon Order ID to match with fulfillment data if you handle logistics directly.
Implementation Steps:
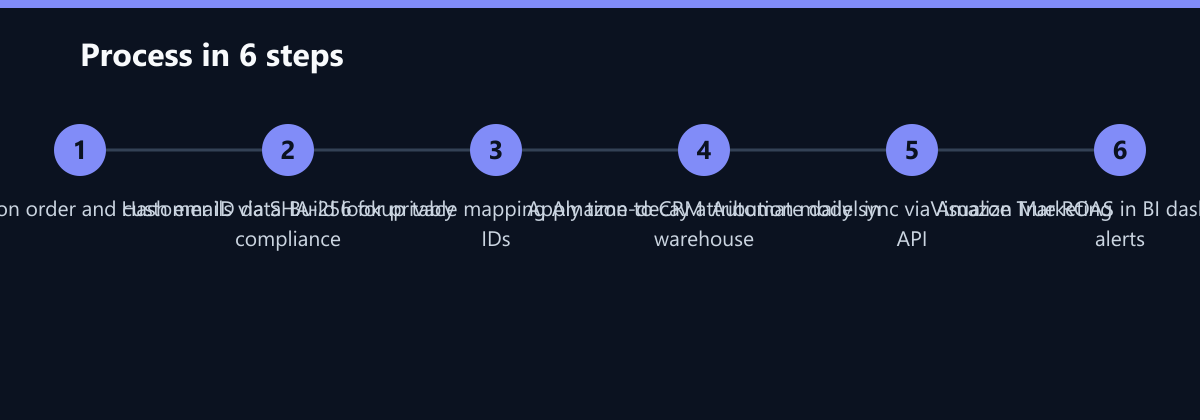
- Export Amazon order data including Customer ID and Order ID.
- Extract email addresses from post-purchase communications or account registrations.
- Hash all email addresses using the same algorithm in both systems.
- Create a lookup table in your data warehouse that maps Amazon IDs to CRM IDs.
This mapping allows you to trace every Amazon ad click to a specific CRM account, ensuring that revenue is attributed to the correct source.
Step 2: Building the Attribution Model
Once data is unified, you need an attribution model. Last-click attribution is insufficient for B2B. Use a multi-touch attribution model to distribute credit across all touchpoints. This ensures that awareness campaigns are valued alongside conversion campaigns.
Recommended Model: Time-Decay Attribution
This model gives more weight to recent interactions but still credits earlier touches. It reflects how B2B buyers research before purchasing, acknowledging that early engagement builds the foundation for later conversion.
| Touchpoint | Example | Weight |
|---|---|---|
| First Touch | Amazon Display Ad | 20% |
| Middle Touch | Email Nurture Sequence | 30% |
| Last Touch | Sales Demo | 50% |
To calculate True ROAS, follow these steps:
- Sum the total revenue attributed to each campaign in the CRM.
- Divide by the total ad spend for that campaign.
- Compare with Direct ROAS to identify the value gap.
Formula:
True ROAS = (Total CRM Revenue Attributed to Campaign) / (Total Ad Spend)
This metric shows the real return on investment. It highlights which campaigns drive long-term value, allowing you to make informed decisions about budget allocation.
Step 3: Automating the Data Flow
Manual data transfers are error-prone and slow. Automate the flow between Amazon, your data warehouse, and your CRM. Use tools like HubSpot, Salesforce, or custom ETL scripts to ensure data integrity. Automation is critical for maintaining accuracy at scale.
Key Integration Points:
- Amazon to Data Warehouse: Use Amazon Marketing API to pull ad spend and conversion data daily.
- Data Warehouse to CRM: Sync mapped customer IDs and revenue data back to CRM fields.
- CRM to Analytics Dashboard: Visualize True ROAS in tools like Tableau, Power BI, or Looker.
Benefits of Automation:
- Real-Time Insights: Monitor campaign performance as it happens.
- Reduced Errors: Eliminate manual data entry mistakes.
- Scalability: Handle increasing data volumes without extra effort.
Set up alerts for significant changes in True ROAS. This allows your team to react quickly to market shifts or campaign fatigue, ensuring that you can pivot strategies before losses compound.
Typical Mistakes to Avoid
Even with the right tools, teams often make critical errors that skew True ROAS calculations. Avoid these common pitfalls:
- Ignoring Match Rates: If only 40% of Amazon customers match to CRM records, your True ROAS is based on a biased sample. Investigate why matches fail (e.g., typos in emails, lack of post-purchase capture) and improve data quality.
- Using Static Attribution Windows: B2B sales cycles vary. A fixed 30-day window may exclude valid conversions. Use dynamic windows or time-decay models that account for the actual sales duration.
- Neglecting Cross-Channel Influence: If a customer clicks an Amazon ad but converts via a LinkedIn retargeting campaign, last-click attribution on LinkedIn will steal the credit. Ensure your attribution model accounts for cross-channel touchpoints.
- Overlooking Data Latency: CRM data may lag behind actual revenue recognition. Ensure your system accounts for this delay to avoid underestimating recent campaign performance.
How You Measure Success
To ensure your True ROAS implementation is effective, track these concrete KPIs:
- Match Rate: Percentage of Amazon customers successfully linked to CRM records. Target: >80%. Method: Compare unique Amazon Customer IDs with matched CRM records.
- True ROAS vs. Direct ROAS Ratio: The multiplier between True and Direct ROAS. A ratio >2x indicates significant long-term value. Method: Calculate ratio monthly.
- Time to Attribution: Average time from ad click to CRM revenue recognition. Target: <60 days for B2B SaaS. Method: Track timestamp differences in data warehouse.
- Budget Reallocation Impact: Change in qualified leads after shifting budget to high-True-ROAS keywords. Target: >15% increase. Method: A/B test budget allocation before and after.
Checklist for Implementation
- Audit current Amazon data exports for completeness.
- Verify SHA-256 hashing consistency across systems.
- Build and test the Amazon-to-CRM lookup table.
- Implement time-decay attribution logic in data warehouse.
- Set up automated daily data sync via API.
- Create BI dashboard with True ROAS KPIs and alerts.
Actionable Insights for Marketing Leaders
With True ROAS data, you can make data-driven decisions. Focus on these three areas:
- Keyword Optimization: Identify keywords with low Direct ROAS but high True ROAS. Increase budget on these terms to capture long-term value.
- Customer Segmentation: Analyze which customer segments acquired via Amazon have the highest LTV. Tailor ads to these personas to improve efficiency.
- Channel Mix: Compare True ROAS across Amazon, Google, and LinkedIn. Allocate budget to the channels that drive the most lifetime value.
Example Scenario:
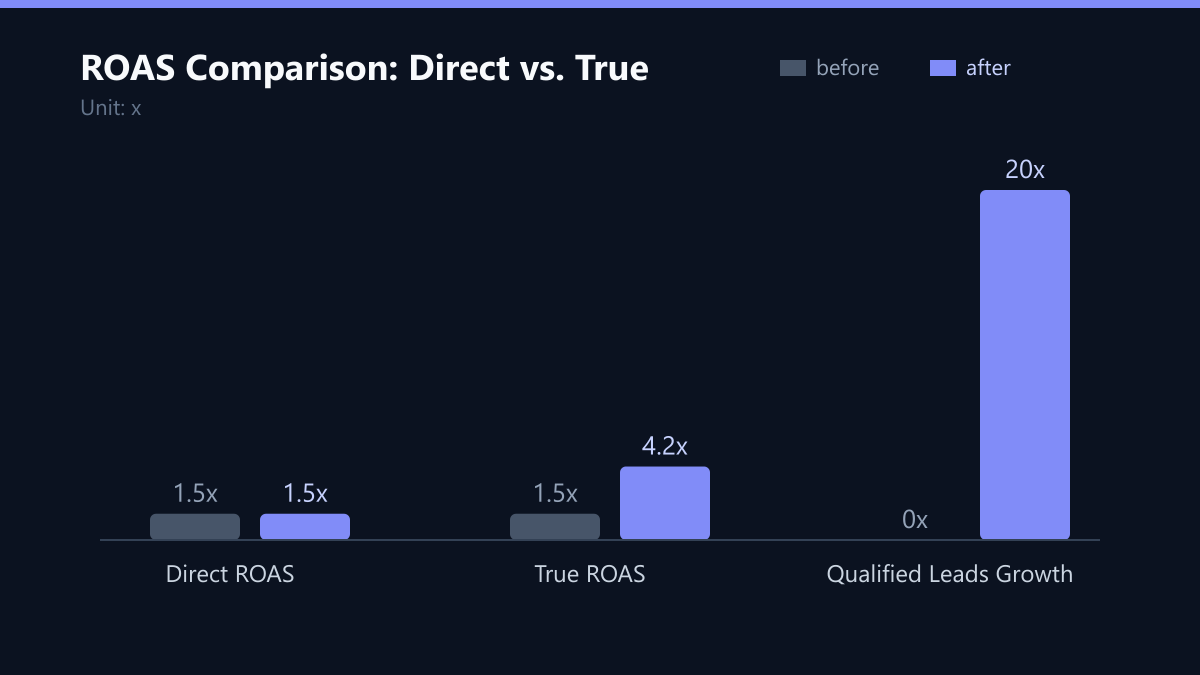
A B2B SaaS company finds that Amazon Display ads have a Direct ROAS of 1.5x. However, True ROAS is 4.2x because these ads drive high-quality leads to the sales team. The company increases Display ad spend by 30%, resulting in a 20% increase in total qualified leads. This demonstrates the power of True ROAS in revealing hidden value.
Key Takeaways:
- Direct ROAS is a vanity metric for B2B.
- True ROAS reflects actual business value.
- Automation is essential for accurate measurement.
- Use multi-touch attribution for fair credit distribution.