The High Cost of Static Pricing
Most mid-sized companies still rely on static price lists or manual Excel sheets to manage their marketplace presence. This approach fails to capture real-time market fluctuations. Competitors adjust prices within minutes, while your team updates them weekly.
The core problem is latency. By the time a manual update is approved and deployed, the market opportunity has often passed. This leads to two costly outcomes:
- Lost Sales: Prices remain too high during demand spikes, pushing buyers to faster-reacting competitors.
- Margin Erosion: Prices stay too low during demand dips, giving away profit unnecessarily.
Static pricing treats every customer and every moment as identical. It ignores inventory levels, competitor moves, and seasonal trends. In a competitive marketplace, this rigidity is a direct threat to profitability. You are essentially flying blind in a dynamic environment.
How Algorithmic Pricing Works
Automated pricing systems use algorithms to set prices in real time. They process multiple data points simultaneously to determine the optimal price point. Unlike manual adjustments, which are reactive, these systems are proactive and predictive.
Key data inputs include:
- Competitor Prices: Scraped from rival listings in real time to ensure competitive positioning.
- Demand Signals: Search volume, cart abandonment rates, and click-through rates indicate buyer intent.
- Inventory Levels: Current stock availability and replenishment schedules prevent stockouts or overstocking.
- Cost Structures: Variable costs, shipping fees, and marketplace commissions are factored into every calculation.
The algorithm calculates a price that maximizes a specific goal, such as profit margin or market share. It does not guess; it calculates based on predefined rules and historical data. This shifts pricing from an art to a science.
Defining Your Strategic Objectives
Before deploying algorithms, you must define your business goals. The algorithm needs a clear objective to optimize for. Without a defined target, the system may optimize for the wrong metric.
Common strategic objectives include:
- Maximize Profit: Set prices to capture the highest possible margin per unit, even if volume drops slightly.
- Maximize Revenue: Focus on total sales volume, accepting thinner margins to drive top-line growth.
- Compete on Price: Undercut competitors to gain market share quickly, useful for new product launches.
- Clear Inventory: Aggressively discount slow-moving stock to free up capital and reduce holding costs.
You must also set guardrails. Define minimum and maximum prices to protect brand equity. For example, a typical rule might be to never drop below 80% of the cost price. These rules ensure the algorithm acts within your business boundaries and prevents catastrophic pricing errors.
Implementation Roadmap for Mid-Market Teams
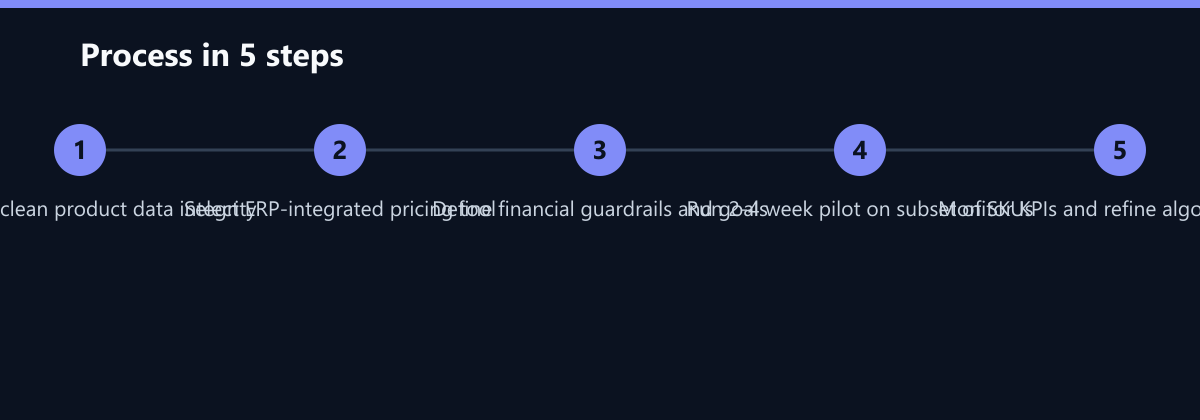
Implementing automated pricing does not require a full-scale IT overhaul. You can start with a phased approach that minimizes risk and allows for iterative learning.
- Audit Current Data: Ensure your product data is clean and consistent. The algorithm is only as good as its input. Inconsistent SKU data leads to pricing errors.
- Select a Tool: Choose a pricing engine that integrates with your existing ERP and marketplace channels. Look for APIs that support real-time data sync.
- Define Rules: Collaborate with finance and sales to set pricing boundaries and goals. Document these rules clearly to avoid ambiguity.
- Run a Pilot: Test the algorithm on a small subset of SKUs for two to four weeks. Start with 50–100 high-velocity items.
- Monitor and Adjust: Compare pilot results against manual pricing baselines. Refine rules based on performance data.
Focus on integration. The system must pull data from your CRM and ERP automatically. Manual data entry defeats the purpose of automation. Ensure the tool supports the specific marketplaces you operate in, such as Amazon, eBay, or your own B2B portal. A typical integration setup takes 2–3 weeks, including API configuration and data mapping.
Measuring Success and ROI
You need clear metrics to prove the value of automated pricing. Track performance against your previous manual methods. Without baseline data, you cannot quantify the improvement.
Key performance indicators (KPIs) to track:
- Margin per Unit: The average profit margin achieved per sale. This is the primary financial indicator.
- Win Rate: The percentage of items ranked #1 in search results or winning the buy box. Higher win rates correlate with increased visibility.
- Sell-Through Rate: The speed at which inventory is sold. Faster sell-through reduces storage costs and capital tied up in stock.
- Revenue Growth: Total sales revenue compared to the previous period. Ensure this is adjusted for seasonality.
Example Impact Comparison:
| Metric | Manual Pricing | Automated Pricing |
|---|---|---|
| Avg. Margin | 18% | 24% |
| Win Rate | 35% | 52% |
| Update Frequency | Weekly | Real-time |
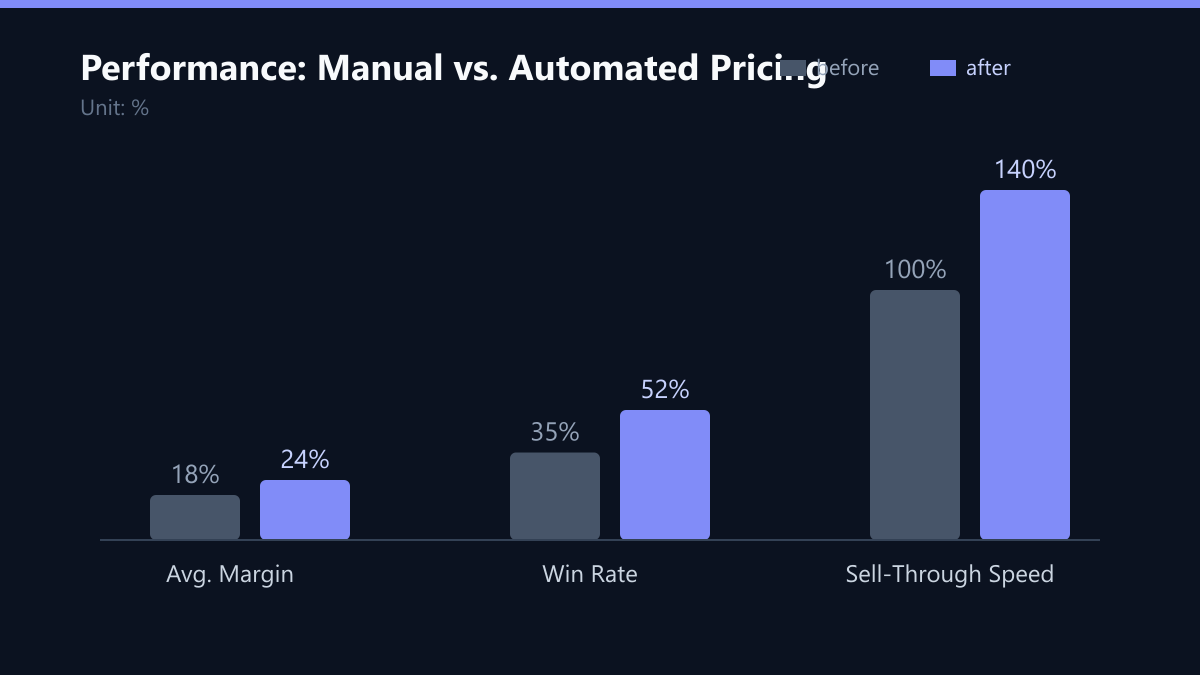
A 6% increase in margin can significantly impact bottom-line profits. If you sell 10,000 units a month, a 6% margin increase on a $100 average price point yields $6,000 in additional monthly profit. Over a year, this amounts to $72,000 in extra profit from the same sales volume. Additionally, the improved win rate of 17 percentage points (from 35% to 52%) typically leads to a 15–20% increase in organic traffic to your listings, further compounding revenue growth.
Typical Mistakes to Avoid
Many companies fail to realize the full potential of automated pricing due to implementation errors. Avoid these common pitfalls:
- Ignoring Brand Positioning: Aggressive discounting can damage your brand image. If you are a premium brand, do not use a strategy that undercuts low-cost competitors. Ensure your pricing strategy aligns with your brand identity.
- Lack of Guardrails: Without minimum price limits, algorithms may drive prices too low during competitive spikes. Always set a hard floor price based on your break-even point.
- Data Silos: If your pricing tool cannot access real-time inventory data, it will make poor decisions. It may lower prices on items you are about to run out of, leading to stockouts and lost sales.
- Over-Optimization on Price: Focusing solely on price ignores other factors like product quality, reviews, and customer service. A slightly higher price with excellent reviews often outperforms a lower price with poor service.
How You Measure Success
To rigorously measure success, use a control group approach. Keep 10% of your SKUs on manual pricing as a control group. Compare the automated group against this control over a 90-day period.
Methodology:
- Baseline Establishment: Record average margin, win rate, and sell-through rate for the control group for 4 weeks.
- A/B Testing: Apply automated pricing to the test group. Ensure both groups have similar product categories and price points.
- Statistical Significance: Use a t-test to determine if the differences in margin and win rate are statistically significant (p-value < 0.05).
- ROI Calculation: Calculate the total additional profit generated by the test group minus the cost of the pricing software and implementation labor.
Checklist for Launch
Before going live, ensure the following steps are completed:
- Data Audit: 100% of SKUs have accurate cost, inventory, and competitor data.
- Guardrails Defined: Minimum and maximum price limits are set for all product categories.
- Integration Tested: Real-time data sync between ERP and pricing tool is verified.
- Alerts Configured: Notifications are set up for price anomalies or stockouts.
- Team Training: Sales and finance teams understand how to interpret the dashboard and override rules if necessary.
FAQ
How long does it take to see results from automated pricing?
Most teams see initial improvements in win rates within two weeks. Significant margin improvements typically emerge after four to six weeks of data collection and algorithm optimization. The system learns from each transaction, refining its accuracy over time.
Can automated pricing handle B2B bulk orders?
Yes, but it requires specific configuration. B2B pricing often involves tiered discounts and contract prices. The algorithm must be programmed to recognize customer segments and apply volume-based discounts automatically. Ensure your tool supports complex pricing rules for B2B scenarios.
Do I need a data scientist to set up these algorithms?
No. Modern pricing tools are designed for business users. They provide pre-built templates and rule-based engines. You define the business logic, such as minimum margins and competitor references. The software handles the mathematical optimization. Technical expertise is only needed for custom integrations.
What happens if the algorithm makes a pricing error?
Errors are rare when proper guardrails are in place. However, if a price drops too low, the system should trigger an alert. You can set up manual overrides or pause the algorithm for specific SKUs. Regular monitoring and clear minimum price limits prevent significant financial loss.