The Hidden Profit Killer: Understanding Return Costs
Returns are often viewed as a minor operational nuisance, but for mid-market sellers, they represent a significant drain on profitability. The cost extends far beyond the refund itself; it includes restocking fees, reverse logistics shipping, and potential inventory write-offs if the item cannot be resold. For a business operating on tight margins, a return rate of 10% can effectively erase the profit generated in an entire quarter.
The critical insight here is that the root cause is rarely product quality. Instead, it is almost always an expectation mismatch. Customers buy based on what they perceive from the listing, and when the physical product fails to match that mental model, a return is initiated. This gap typically stems from three specific areas:
- Vague Descriptions: Bullet points that focus on marketing fluff rather than factual specifications.
- Low-Resolution Imagery: Images that do not clearly show scale, texture, or functional details.
- Hidden Limitations: Functional constraints (e.g., “not waterproof”) that are buried in the text or omitted entirely.
Addressing these gaps directly within the purchase funnel is the most effective Customer Relationship Optimization (CRO) lever available. You do not need to redesign the product; you need to redesign how the product is presented. By aligning the customer’s expectations with the reality of the product, you reduce the friction that leads to returns.
Engineering Clarity with A+ Content
A+ Content is not just a branding tool; it is a primary instrument for risk reduction. Standard bullet points are often too brief to convey the nuances of complex products. By leveraging modular A+ Content, you can control the narrative before the customer adds the item to their cart. The goal is to eliminate guesswork.
Focus on negative space and transparency. Do not hide limitations. If a product is not compatible with a specific software version, or if it requires a specific type of socket, state it clearly. Transparency builds trust and, more importantly, filters out incompatible buyers before the sale is made.
Key modules to prioritize include:
- Comparison Charts: These are essential for preventing wrong-item purchases. If you sell multiple variants (e.g., different sizes or colors), a visual comparison chart helps customers select the exact variant they need.
- Technical Specifications: Use dedicated modules to detail dimensions, weight, material composition, and compatibility. This is particularly vital for B2B buyers who rely on precise data for procurement decisions.
- Use Case Scenarios: Show the product in real-world contexts. If a tool is for industrial use, show it in an industrial setting. This sets usage expectations and reduces returns due to improper application.
Transforming Brand Stores into Support Hubs
Brand Stores serve as a digital showroom, but their most underutilized function is as a self-service support hub. Many returns occur simply because customers cannot find answers to their questions quickly enough. If a customer has to contact support to ask, “Does this fit my machine?”, the delay often leads to impulse buying or, worse, a return after delivery when the answer turns out to be “no.”
Integrate a comprehensive FAQ section directly into your Brand Store navigation. This section should address the top 10 return drivers for your specific category. For example, if you sell apparel, focus on sizing and fit. If you sell electronics, focus on installation and compatibility.
Structure your store pages with a clear hierarchy to guide users efficiently:
- Homepage: Direct traffic to specific product categories rather than generic listings.
- Category Pages: Use call-to-action buttons that guide users to detailed product pages or specific comparison charts.
- FAQ Hub: Embed short video tutorials showing installation or usage steps. Video is often more effective than text for demonstrating complex procedures.
- Contact Path: Provide a clear, direct path to human support for complex queries that cannot be answered by static content.
This structure reduces bounce rates and increases the likelihood of informed purchases. By providing answers upfront, you reduce the cognitive load on the customer and the administrative load on your support team.
Measuring Impact: Data-Driven Iteration
Intuition is not enough in marketplace optimization. You must measure the impact of content changes on return rates. While Amazon provides limited direct data on the specific reasons for returns, you can infer trends by analyzing customer reviews and return reason codes.
A systematic approach to data analysis includes:
- Review Analysis: Categorize negative reviews by theme. Look for keywords like “too small,” “broke easily,” or “not as described.” These are direct indicators of content gaps.
- Return Reason Mapping: Map Amazon return codes to specific product features. If the code “Item not as described” is high, audit your images and descriptions for accuracy.
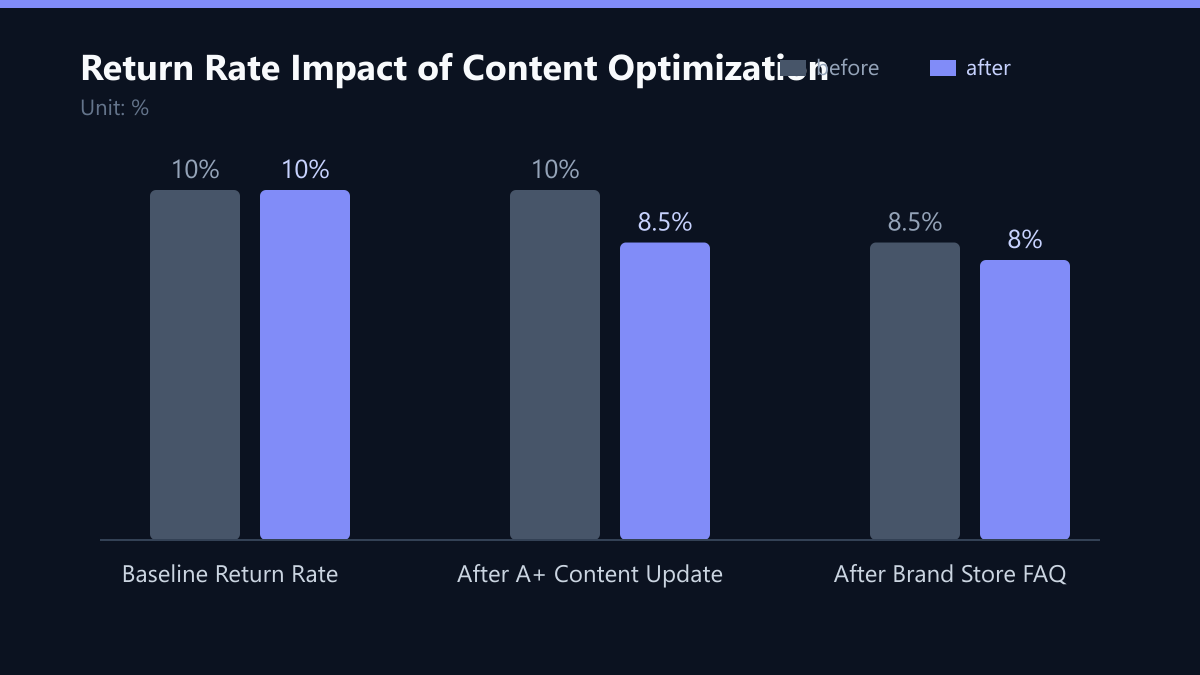
- A/B Testing: Test different A+ Content modules against each other. For instance, test a version with a comparison chart against a version without one. Track the correlation between content updates and return rate changes over a 30-day period.
If a new comparison chart reduces returns of the wrong variant by 5%, scale that format to other SKUs. Data beats guesswork. Consistent measurement allows you to identify which content elements drive the most significant reductions in returns.
Typical Mistakes to Avoid
Even with a solid strategy, implementation errors can negate the benefits. Here are the most common pitfalls:
- Over-Promotional Language: Using marketing buzzwords instead of facts. Customers returning items often feel misled by exaggerated claims. Stick to precise, factual descriptions.
- Ignoring Negative Feedback: Focusing only on positive reviews. Negative reviews contain the most valuable insights for content optimization. Analyze them ruthlessly.
- Static Content: Treating A+ Content and Brand Stores as one-time projects. Customer expectations and product lines evolve. Regularly update content to reflect new features or common questions.
- Lack of Ownership: Spreading responsibility across multiple teams. Without a single owner accountable for content performance, updates often stall or become inconsistent.
How You Measure Success
To determine if your CRO efforts are working, track the following KPIs:
- Return Rate (by SKU): The percentage of units returned relative to units sold. Target a 15-20% reduction from baseline.
- Return Reason Distribution: The breakdown of returns by reason code. A successful strategy shifts returns from “Not as described” to “Changed mind” or “Defective” (which are less content-related).
- Customer Service Ticket Volume: The number of pre-purchase inquiries. A well-optimized Brand Store should reduce this volume by 10-15%.
- Conversion Rate: While the primary goal is reducing returns, improved clarity should also boost conversion rates by building trust.
Use a 30-day rolling window to smooth out weekly fluctuations. Compare these metrics against a control group of SKUs that have not received content updates to isolate the impact of your changes.
Implementation Checklist for Mid-Market Teams
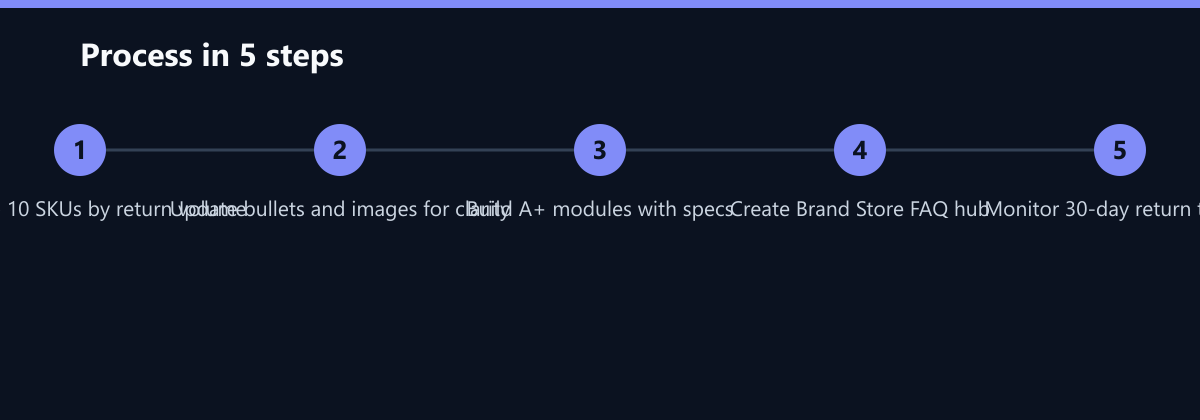
You do not need a large team to implement these changes. Start with your top 10 SKUs by return volume. Prioritize high-impact, low-effort changes. Here is a 4-week roadmap:
-
Week 1: Audit and Baseline
- Identify the top 10 SKUs with the highest return rates.
- Analyze return reasons and negative reviews for each SKU.
- Document the current state of A+ Content and Brand Store pages.
-
Week 2: Content Creation
- Update bullet points and images for clarity and accuracy.
- Create A+ Content modules with comparison charts and technical specifications.
- Ensure all limitations and compatibility issues are clearly stated.
-
Week 3: Brand Store Optimization
- Build or update the Brand Store with a dedicated FAQ section.
- Embed video tutorials for installation or usage.
- Implement clear navigation hierarchy and call-to-action buttons.
-
Week 4: Monitoring and Adjustment
- Monitor return rates and customer reviews daily.
- Compare performance against the baseline.
- Adjust content based on emerging feedback or new return patterns.
Assign a single owner for this process. Ensure they have access to Amazon Seller Central analytics and can update content without waiting for lengthy approval chains. Agility is key to reducing return rates in a dynamic marketplace environment. By following this structured approach, you can transform your content from a passive description into an active tool for profit protection.
Passend dazu
- Reducing Customer Acquisition Cost by 22% for a Benelux industrial manufacturer with automated re-engagement campaigns
- Performance Marketing
- Reducing Cart Abandonment by 22 Percent with Personalized CRO Popups
- Reducing Reporting Time by 60% with Centralized RevOps Dashboards
- Content & CRO
- Affiliate Marketing
- CRM Marketing
- Boosting Organic Rankings with A+ Content and Review Strategies
- From Visitors to Customers: Content Clustering for Higher Email Open Rates
- Dynamic Fields in B2B Emails: Boosting Open Rates with Precision
- Amazon Brand Registry: 7 Steps to Fully Secure Your Brand Against Counterfeiters
- How Hidden Amazon FBA Fees Impact Your Return on Ad Spend
- Consent Mode V2 for B2B: Reducing Data Loss and Boosting Tracking Efficiency
- Boosting US B2B Open Rates by 50% with Interactive Klaviyo Flows
- Reducing Bounce Rate by 35% in UK Industrial Supply Chain
- Top 5 Tools to Monitor Your Brand in AI Search Results
- A/B Testing Strategy for B2B with Limited Traffic
- LLM-Friendly Content Structure: Optimizing H2 and H3 Tags for AI Visibility
- Domain Authority in the AI Era: Positioning Your Brand in LLM Training Data
- Content Clusters for AI Search: Silo vs. Thematic Approaches for B2B
- Reducing Commission Errors by 30% via Automation
- Generating 400 New MQLs Per Quarter With Segmented Content Drips in Asia
- Reducing Storage Costs by 30% via Predictive Demand Forecasting
- Cutting Webinar Costs by 25% with Multilingual Content Repurposing
- Technical SEO vs. GEO: Key Factors for AI Content References
- Converting Passive Webinar Registrants with On-Demand Content
- Leveraging User-Generated Content to Reduce Churn in Nordic Subscription Markets
- Doubling Video Completion Rates with Personalized Product Demos in DACH Machinery
- EU Legal Frameworks for Brand Community Moderation
- Tripling User-Generated Content Production in US E-Commerce