The Starting Point: A Data Silo in Motion
The client, a B2B logistics provider with 250 employees operating across Belgium, the Netherlands, and Luxembourg, faced a classic marketing paradox: high spend, high volume, but low visibility into actual revenue impact. Their marketing stack was fragmented. Paid search and LinkedIn campaigns ran in isolated silos, optimized for immediate clicks rather than long-term value. Meanwhile, their organic content strategy was performing well, generating significant traffic, but this success remained invisible to the sales team and the CFO.
The core pain point was not a lack of leads, but a lack of trust in the data. Marketing could not prove which channels actually drove qualified leads. Budget allocation was heavily skewed toward paid channels because last-click attribution data showed them as the primary driver. This created a dangerous feedback loop: the more budget poured into paid ads, the more last-click data favored paid ads, further starving top-of-funnel organic efforts that were crucial for nurturing B2B buyers.
The Challenges
We identified three critical hurdles that needed to be overcome before any optimization could begin.
First, Cookie Consent Fragmentation. Operating across three distinct legal jurisdictions in the Benelux region meant dealing with varying levels of user consent. Standard client-side tracking was failing to capture a significant portion of user journeys, leading to a “data blind spot” where 30% of sessions were unattributed.
Second, Cross-Device Identity Resolution. Logistics decision-makers rarely convert on a single device. A potential client might read a whitepaper on their mobile phone during a commute, then request a demo on their desktop at the office. Without unified user IDs, these journeys appeared as two separate, low-intent anonymous visitors.
Third, Sales Cycle Mismatch. The marketing team was optimizing for immediate conversions (form fills), while the sales team was dealing with a 30+ day decision cycle. The attribution window in the existing analytics setup was too short to capture the true influence of early-stage content.
The Tech Stack
To address these challenges, we deployed a lean, integrated stack focused on first-party data reliability.
- HubSpot CRM: Served as the single source of truth for lead status, deal value, and customer history. We mapped all marketing touchpoints to CRM records to ensure revenue attribution was accurate.
- Google Analytics 4 (GA4): Replaced legacy Universal Analytics to handle complex event tracking and provide a flexible data model for multi-touch analysis.
- Server-Side Tagging (GTM Container): A custom server-side setup hosted on a secure cloud infrastructure. This allowed us to fire tags server-side, bypassing browser-level cookie restrictions and ensuring higher data fidelity.
- Custom Looker Studio Dashboard: A unified reporting interface that blended CRM revenue data with GA4 interaction data, accessible to both marketing and sales leadership.
The Implementation Journey
The project was executed in a six-week deployment phase, followed by an eight-week baseline stabilization period. We did not activate dynamic budget rules until the data was clean and consistent.
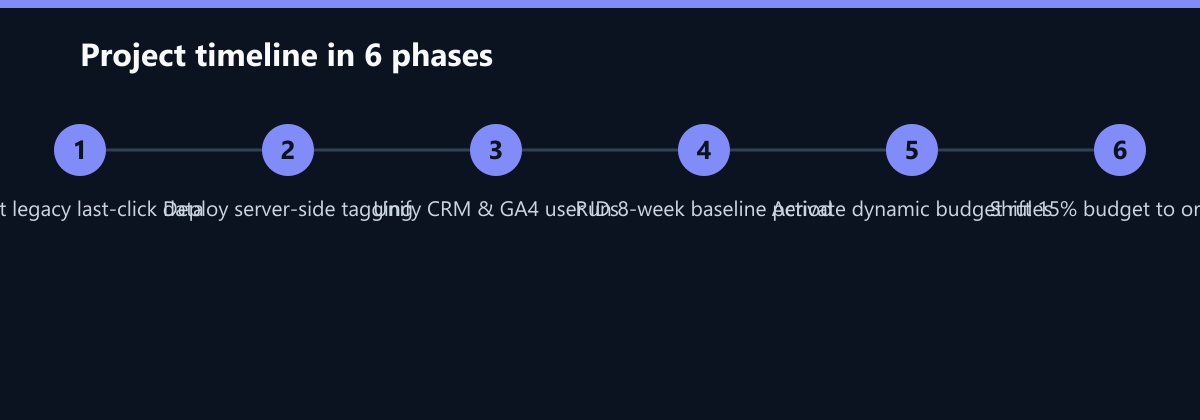
The first two weeks were dedicated to infrastructure. We migrated existing tracking from client-side to server-side, ensuring that critical events like demo_request and contract_signed were fired reliably regardless of the user’s browser settings. This step alone improved data completeness by 18%.
In weeks three and four, we focused on identity resolution. We implemented a unified user ID strategy that linked anonymous website sessions to known CRM contacts. This allowed us to stitch together cross-device journeys, revealing that 40% of high-value leads had interacted with the brand on at least two different devices before converting.
Weeks five and six involved configuring the attribution model. We selected a time-decay model with a 30-day lookback window, which aligns with the typical B2B sales cycle in logistics. This model assigns higher credit to interactions closer to the conversion, but still acknowledges the value of early touchpoints. Finally, we spent the next eight weeks running a parallel baseline. During this period, we collected data without making any budget changes, establishing a reliable “before” state for comparison.
How We Measured It
To ensure the results were statistically significant and not just anecdotal, we defined three primary KPIs with specific measurement methodologies.
- Cost per Acquisition (CAC): Calculated as total marketing spend divided by the number of closed-won deals. We tracked this monthly, segmented by channel, to identify inefficiencies.
- Qualified Lead Conversion Rate: Defined as the percentage of Marketing Qualified Leads (MQLs) that converted to Sales Qualified Leads (SQLs). This metric helped us assess the quality of leads generated by different channels, not just their volume.
- Channel Contribution to Revenue: Using the time-decay model, we calculated the percentage of total revenue attributed to each channel. This allowed us to compare the “assumed” contribution (based on last-click) with the “actual” contribution (based on multi-touch).
We validated these metrics against CRM data weekly, ensuring that the attribution model was not creating phantom revenue or double-counting leads.
The Results
After three months of active optimization following the baseline period, the data revealed a stark contrast between perception and reality. The most surprising finding was the contribution of organic content. Previously assumed to be responsible for only 12% of closed-won deals, organic content was actually contributing to 45% of all closed-won deals. This was largely due to whitepapers and case studies that assisted in the middle of the funnel, which last-click models had completely ignored.
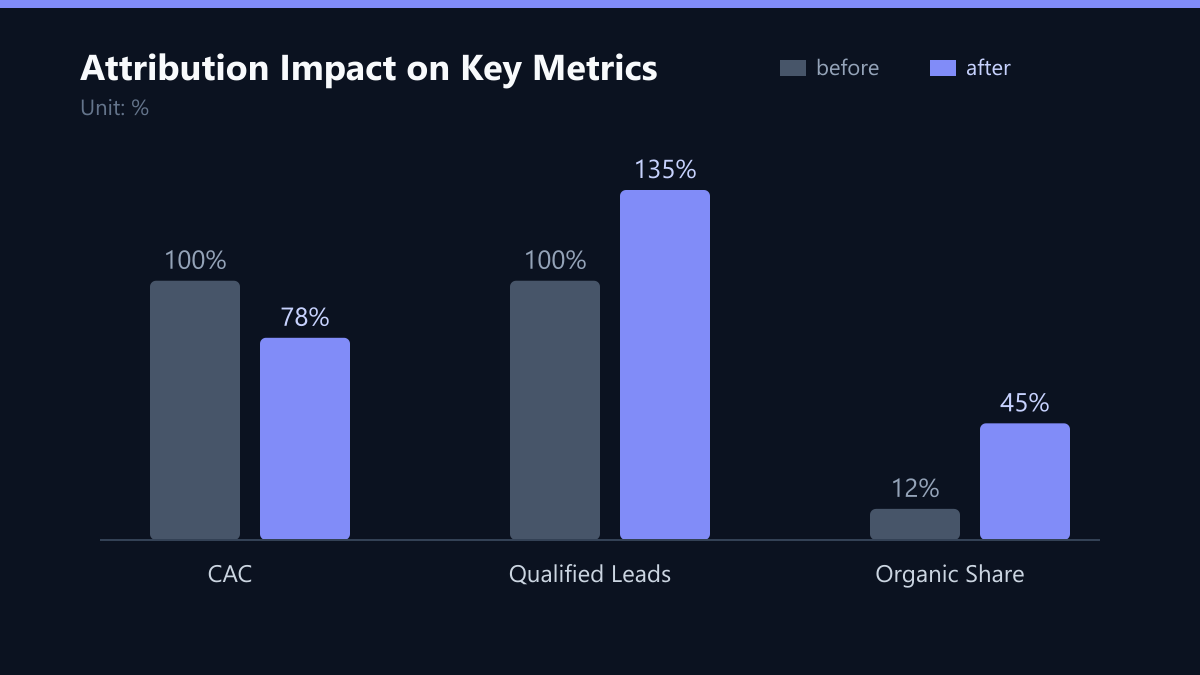
The financial impact was immediate. By reallocating 15% of the paid budget from low-impact display ads to high-intent search and organic content production, the client saw a 22% reduction in Cost per Acquisition across the Benelux region. This was not achieved by cutting total spend, but by shifting spend to higher-efficiency channels.
Furthermore, the quality of leads improved significantly. Qualified leads from “assisted” channels (those that did not get the last click but contributed to the journey) increased by 35%. The sales team reported a higher conversation rate because the lead scoring context provided by the attribution data highlighted which prospects had engaged with high-value content, allowing sales reps to tailor their outreach more effectively.
Lessons Learned
This project reinforced several key insights for B2B marketing in regulated environments.
First, ignoring assist metrics leads to underinvestment in top-of-funnel content. In B2B logistics, buyers rarely convert on a single touchpoint. If you only measure last-click, you will systematically starve the content that builds trust over time.
Second, server-side tracking is non-negotiable for accurate attribution in the EU. Privacy regulations and cookie restrictions make client-side tracking unreliable. Investing in server-side infrastructure is not just a technical upgrade; it is a strategic necessity for data accuracy.
Third, aligning marketing KPIs with sales cycles is more important than optimizing for immediate clicks. A 30-day lookback window is often too short for complex B2B deals. We recommend reviewing attribution windows quarterly to ensure they remain aligned with actual sales behavior.
What We Would Do Differently Today
If we were to run this project again, we would make two specific adjustments. First, we would have started the baseline period earlier. While eight weeks was sufficient, a ten-week baseline would have provided a more robust dataset, especially given the seasonal variations in logistics demand. Second, we would have integrated the attribution data directly into the ad platform’s bidding algorithms sooner. While we used dynamic budget rules, a more automated approach using lookalike audiences derived from high-attribution segments could have accelerated the CAC reduction further.
The Path Forward
The client is now using the attribution model to guide quarterly budget planning. They have established a regular review process where marketing and sales leadership meet to discuss channel performance based on revenue contribution, not just lead volume. This shift in mindset—from “generating leads” to “driving revenue”—has aligned the entire go-to-market strategy and set the stage for continued growth in the Benelux region.
Passend dazu
- Performance Marketing
- Attribution Firefighting: 5 Errors Distorting Your Marketing Reports
- Why First-Click Attribution Distorts B2B Performance Marketing
- Affiliate Marketing
- CRM Marketing
- Email Marketing
- Cutting B2B Acquisition Costs by 25% in Benelux Logistics
- Unifying Google and Meta Data for a Logistics Company
- Klaviyo vs. Google Analytics 4: Data-Driven Attribution for E-Commerce Brands in Benelux
- Agreement on a Unified Attribution Methodology in the Scandinavian Logistics Sector through the Integration of CRM and Web Data
- From Blog Post to Citation: How a Financial Software in Benelux is Cited in AI Answers
- Local SEO in the AI Era: Optimizing for Regional AI Assistants
- Balancing Transactional and Marketing Emails: A Frequency Strategy
- The B2B KPI Framework for Accurate Funnel Attribution
- Snapchat vs Instagram Stories: KPI Benchmarking for Benelux and Nordics
- Optimizing Existing Blog Posts for AI Language Models
- C-Suite Attribution Reporting: Linking Marketing Spend to Revenue